A Lurking, Avoidable Risk in Your Portfolio

The Fed continues to battle inflation but took a little breather this quarter. Stocks have largely ignored the Fed’s messaging about higher rates to come, with the Q1 rally gaining steam in Q2. Investors appear more focused on the prediction of rates falling next year and beyond. But stock gains this year are not broad-based and mask a lurking risk. Luckily this risk is easily identified and avoidable.
The Fed Puts Rate Hikes on Pause
Inflation is still high, but the Fed paused increases in June to better assess the lagged impact of previous hikes. The Fed Funds rate now stands at 5.25%. One goal of the hikes is to tame inflation, but inflation has been sticky. PCE Core Inflation (a preferred Fed measure) is hovering around 4.6%, with limited downward movement this year. As such, despite the pause, more rate increases are expected this year. The average peak rate forecast by the Fed is now 5.6%, up from 5.1% this time last quarter. Peak rates are a moving target but are still forecast to be reached in 2023.
Chart 1: The Fed paused hikes in June, with peak rates expected later in 2023
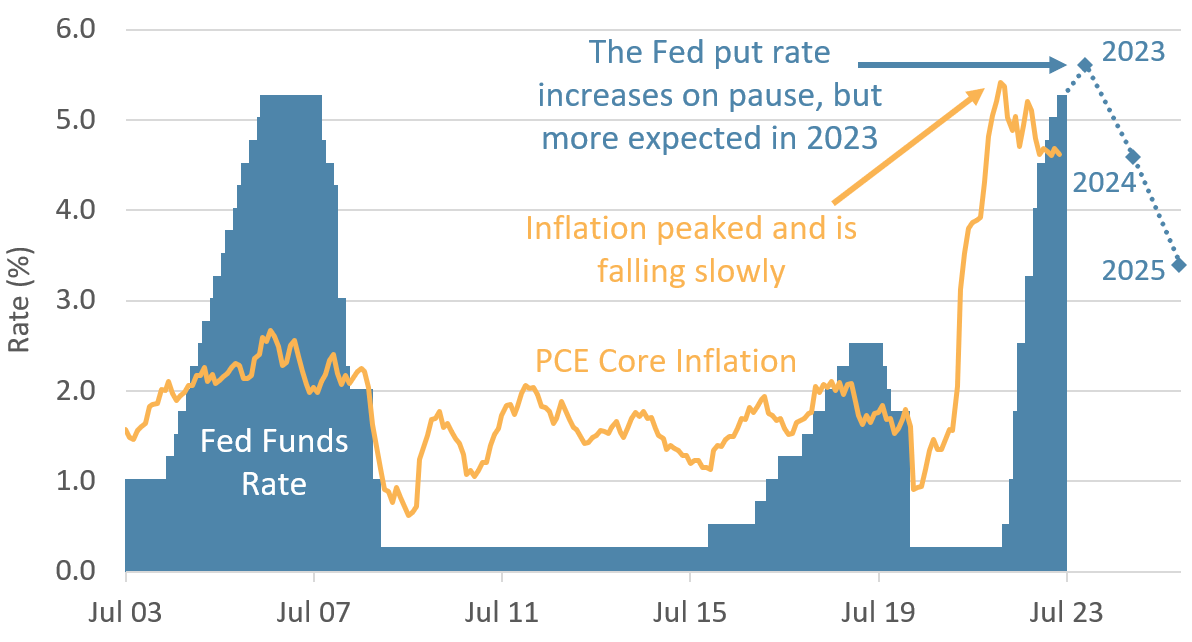

Source: the US Federal Reserve, Bureau of Economic Analysis
Stocks Climb the Wall of Worry
There has been much to distract and concern investors in 2023. In Q1, it was high-profile bank failures. In Q2, there were numerous headlines about impending economic doom due to the seemingly impossible debt ceiling negotiations. We covered the debate ad nauseam in our Insights publication (Politic-Proof Your Portfolio, Keep Your Investments Sunny Side Up, Stay In Control of Your Investments). A message we put forward was not to overreact to sensational headlines. Investors have no edge in the short run, and trying to predict both the outcome of the debt ceiling debate and the market’s reaction to it is a fool’s errand. A better approach is to focus on long-term market fundamentals and identify real, tangible opportunities the market provides on any given day. The stock market has a history of climbing the ever-present wall of worry, and this year’s 16.9% return by the S&P 500 is just the latest example.
Chart 2: Equity investors have shrugged off the growing wall of worry
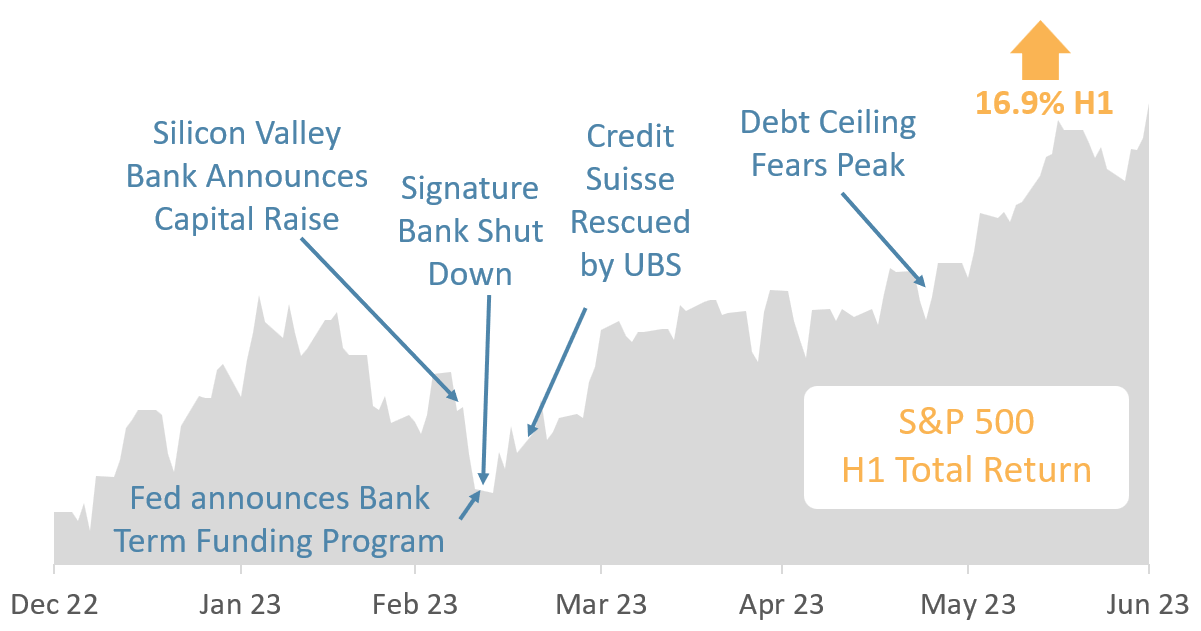

Source: Factset
… But Stock Leadership is Narrow
While the S&P 500 six-month performance of 16.9% is excellent by any measure, if we look under the hood, it was primarily driven by just seven enormous companies: Apple, Microsoft, Alphabet, Amazon, Facebook, Tesla, and NVIDIA. These seven companies account for 28% of the index’s market cap. That is almost half as much as the other 490+ companies combined.
Moreover, these seven megaliths were responsible for nearly three-quarters of the 16.9% total return for H1! Without them, the index would have only produced an investment return of 5.8%. This dynamic is a symptom of unprecedented concentration risk in traditional market-cap-weighted indices like the S&P 500. Right now, equal-weight indices, such as the S&P 500 Equal Weight Index, provide better diversification, in our opinion. That index “only” produced a return of 6.9% in the first half but with far lower concentration risk. Equal-weight indices are fine, though we prefer to avoid concentration risk with factor-weighted indices focusing on Quality, Value, Momentum, and Size.
Chart 3: Strong performance was led by a handful of mega-cap stocks
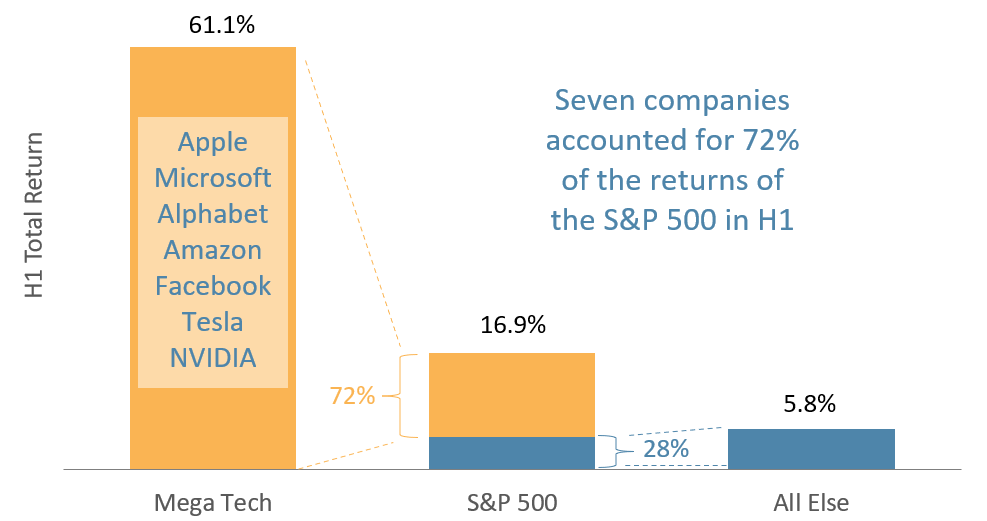

Source: Factset
… And Those Stocks Are Expensive
The concentration risk of the mega-cap tech names in many market-cap-weighted indices is amplified by their high valuations. The seven stocks currently driving the market have an average forward PE of about 42x. That compares to the S&P 500 valuation of 20x. If we exclude those “mega seven” from the calculation, the valuation of the remaining 490+ stocks is a mere 12x. To put that in perspective, the average long-term valuation of the S&P 500 is about 16x (i.e., the bulk of the index is 25% cheaper than the historical average).
There are two implications. Mega-cap tech valuations are high and should be approached with caution. These are great but expensive companies. The other takeaway is that valuation opportunities abound outside of those seven companies.
Chart 4: Concentration risk is amplified by high valuations
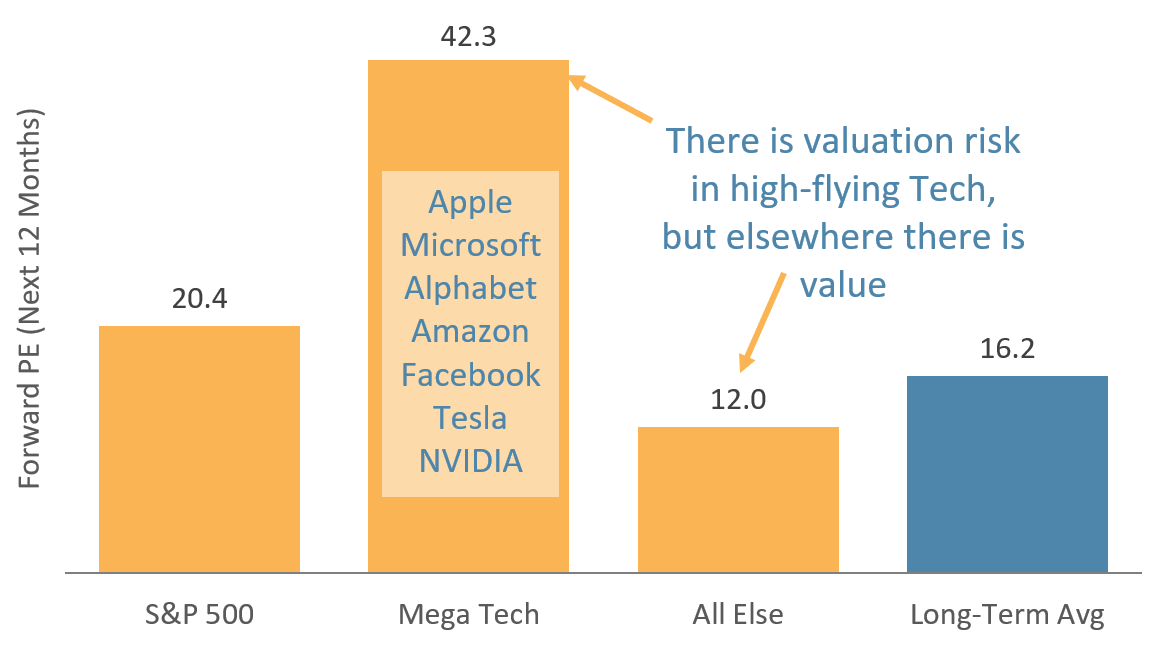

Source: Factset
H1 2023 Has Seen a Rebound in Returns
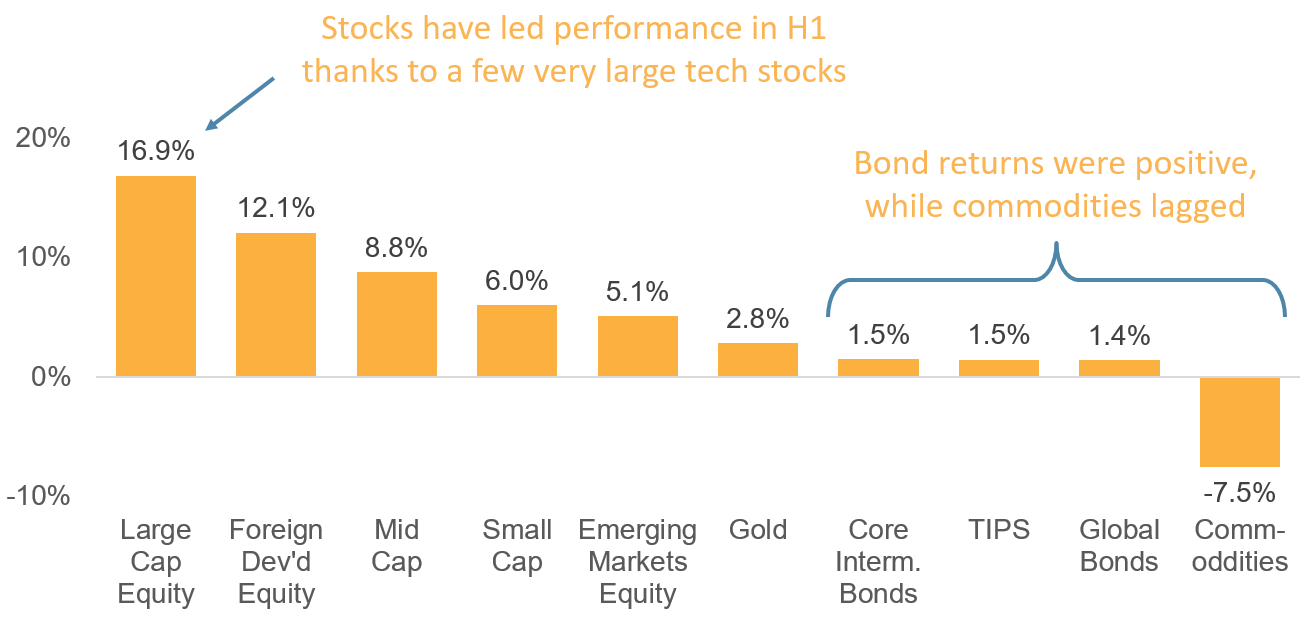
Poor returns in 2022 set up portfolios for better prospects in 2023, which played out in the first half. US Large Cap put in a strong performance, and we now know a handful of mega-cap tech companies led that. Without those tech returns, performance would have been mid-tier in the table below.
Foreign developed posted strong, broad-based performance. Diversification is essential for a robust portfolio, including significant exposure to overseas profits. Bonds have started the year in positive territory after the challenges in 2022, but the big rally predicted by many has yet to materialize. Commodities, the best performers last year, fell meaningfully in the first half. Our preferred real asset is gold, which posted a positive performance.
Chart 5: Asset Class Performance in H1 2023

Source: Factset
Investors need to enter the second half of 2023 with their eyes wide open. Stock returns in the first half were attractive, particularly in market-cap-weighted indices. But the quality of those returns was low. They were on the back of just seven companies (albeit great companies). For investors concentrated in mega-cap tech, now is the time to diversify.
The Fed is adamant that it will re-engage with rate increases. Whether they do or not, further economic slowdown and even a recession are possible. Will this be the tipping point for expensive mega-cap tech? Only time will tell. They may continue to dominate performance, but we are not in the game of speculation. Instead, we focus on the big picture, which shows that that market segment is very expensive. Over the long term, we would expect the better-value portion of the market to outperform. Value is a proven rewarded factor over time, and with the dispersion between Growth and Value so high, at a minimum, ensuring diversification seems prudent. What does a well-diversified portfolio look like in 2023:
- Avoiding market-cap weighted indices. Equal-weighted works, but we prefer a full multifactor approach (indices weighted based on Quality, Value, Momentum, and Size).
- Allocating a material portion of your US stock exposure to Small Cap.
- Ensuring a healthy dose of foreign exposure, including both developed and emerging markets.
- Adding real assets. Our preferred real asset is Gold.
- Including enough fixed-income exposure so your portfolio matches your overall risk tolerance. We have recently added to long-term bonds to lock in today’s elevated rates.
Each investor’s situation is unique, but generally, we see little need to add illiquid, expensive alternatives like cryptocurrencies and private equity to our allocation. Private equity is nothing more than leveraged, small-cap value, which we could replicate directly without the lock-ups and fees if we thought it prudent (which we don’t). Nobel Prize-winning economist Paul Samuelson put it well when he said, “Investing should be more like watching paint dry or watching grass grow. If you want excitement, take $800 and go to Las Vegas.” We see now as a particularly good time to be a boring investor.
On behalf of the entire Strategic Financial Services team, I thank our clients, associates, friends, and family for placing your trust in us. This incredible Strategic community energizes us on a daily basis to continuously elevate our service and offering.

PS – A new picture is coming next quarter… we’ll see if the market ups and downs of the past nine years have added any gray hair and wrinkles.

About Strategic
Founded in 1979, Strategic is a leading investment and wealth management firm managing and advising on total client assets of over $2 billion.
Disclosures
Strategic Financial Services, Inc. is registered with the Securities and Exchange Commission (SEC) as an Investment Advisor. The term “registered” signifies compliance with regulatory requirements and does not imply a certain level of skill or training.
The information provided on our website, including weekly market commentaries, financial planning articles, and other educational resources, is intended solely for educational purposes. It is designed to offer insights into financial planning and investment management, aiming to enhance understanding of financial concepts, strategies, and market trends. This content should not be interpreted as personalized investment advice or a recommendation for any specific strategy, financial planning approach, or investment product. Financial decisions are deeply personal and should be made considering the individual’s specific circumstances, goals, and risk tolerance. We recommend consulting with a professional financial advisor for personalized advice.
Please be aware that Strategic Financial Services, Inc. does not provide legal or tax advice. The content on this website is not intended to be used as such or as a substitute for legal or tax advice from a licensed professional. We advise seeking guidance from qualified legal and tax advisors regarding these matters.
Investment Risks and Portfolio Management.
The discussion of any investments on this website is for illustrative purposes only and provides no guarantee that the advisor will make any investments with the same or similar characteristics as those presented. The investments identified and described herein do not represent all the investments purchased or sold for client accounts. The selection of representative investments to discuss is based on various factors, including recent company news or earnings releases.
It should not be assumed that any investments discussed were or will be profitable. All investments involve risk, including the potential loss of principal. There is no assurance that investments mentioned will remain in client accounts at the time you view this information.
When index returns are mentioned on this site, they are provided as a general indicator of market conditions and are not representative of any client’s portfolio performance. Indices are unmanaged, do not incur management fees, costs, and expenses, and cannot be invested in directly. Therefore, their performance does not reflect the expenses associated with the management of an actual portfolio.
While index returns are used as a framework to report on general market conditions, they should not be construed as an indicator of future performance of any specific investment or portfolio. Discussion of index returns is intended to provide context and insight, not to suggest that clients will achieve similar results. Each client’s portfolio is managed according to their specific investment goals and financial situation.
The opinions and any forward-looking statements expressed in the articles and videos featured in our resource center are as of the date of publication. These statements are based on current laws, regulations, market conditions, and other relevant factors, including third-party data. Given the dynamic nature of financial and regulatory environments, as well as potential changes in market conditions or economic circumstances, the information provided may become outdated or may no longer be accurate.
We rely on third-party data to form our opinions and projections, which means that these are subject to the same uncertainties that affect all data-dependent analyses. As such, we advise readers to exercise caution and not rely solely on the statements made herein for making financial decisions. It is recommended that investors consult with a professional advisor who can help assess the relevance and accuracy of the content in light of the current economic climate and personal financial situation.
Our website contains links to third-party websites as a convenience to our users. Strategic Financial Services, Inc. does not control, endorse, or guarantee the content found on such sites. We are not responsible for the accuracy, legality, or content of the external site or for that of subsequent links.
Contact the external site for answers to questions regarding its content.
The inclusion of any link does not imply our endorsement of the site, nor does it imply any association with its operators. Use of any such linked website is at the user’s own risk.