Skip to content
Resources/Quarterly Market Perspectives
Subscribe
4rd Quarter 2024 Market Update | January 2025

Calmly Traversing the Inevitable Turbulence

Doug Walters, CFA
Positive returns continued in Q4 despite the Fed appearing to catch the market off guard with its diminished outlook. In this quarter’s Perspectives, we recap the quarter and lay out a game plan for the year ahead.

The election is behind us and the Fed has shifted more hawkish as it works to decode the economic calculus of the new administration. The heightened uncertainty, particularly around the future pace of inflation, took a bit of a toll on investments in the fourth quarter, but not enough to tarnish what was another excellent year of returns across many asset classes. As we turn our attention to the coming year, we remind investors to be wary of shiny objects (once again they appear to be in abundance), and that volatility and uncertainty are the friend of the patient and prepared investor.

Dissecting Q4 2024

The Federal Reserve disappointed on its rate outlook

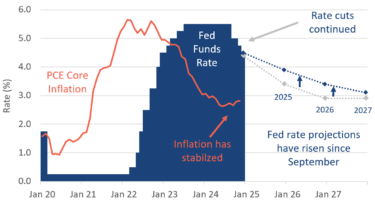
The Fed continued to cut the Fed Funds rate in the fourth quarter, but Chairman Powell flagged inflationary concerns looking forward and tempered expectations for future cuts.

There were multiple drivers of the more hawkish rate stance by the Fed. While PCE Core Inflation (their preferred measure) has fallen well off its pandemic-era peak, the declines have stalled. Inflation has been range-bound between 2.6 and 3.1% in 2024. At the same time, while unemployment rates are still historically low, they have crept up slightly from their 2023 levels. Both of these trends, in isolation, provide reason for pause.

On top of these dynamics, the Fed is trying to gauge what impact the Trump administration’s proposed policies will have on inflation. Taken at face value, higher tariffs, tightening immigration and tax breaks all will put upward pressure on inflation.

Equity and bond markets reacted negatively in Q4 to the change in outlook by the Fed.

Chart 1: Rate Expectations Rise

Chart 1

Source: The US Federal Reserve, Bureau of Economic Analysis

Investors are not being rewarded for taking credit risk

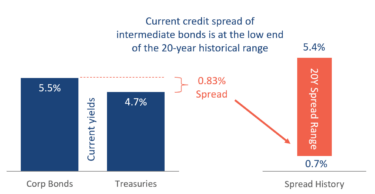
Fixed income yields rose in the fourth quarter, hitting bond performance. At the same time, the spread between the yields on Corporate and US Treasuries generally tightened.

Looking at core, intermediate duration bonds, the spread to Treasuries is historically tight at around 0.8%. As a result, bond investors are not getting much reward for taking on the additional risk that comes with owning corporate debt. How tight is the spread? Looking back over the past 20 years, the spread has varied from 0.7% to 5.4%. So, we are close to the bottom of that range.

We have analyzed the past 10 and 20 years of data and find that when spreads are this tight, intermediate Treasuries have tending to outperform intermediate corporate bonds. The win rate for corporate bonds over those 10 and 20 years is only 24% and 40% respectively1. For this reason, we are currently favoring Treasuries in our strategies.

Chart 2: Credit Spreads Historically Tight

Source: Factset, 20Y history of BBG 5-10Y Treasury and Corporate benchmarks
1. Based on a study of 7-10Y duration benchmarks over the past one and two decades.

US performance driven by a handful of mega-cap companies

For the second year in a row, US Large Cap stocks are up over 20%, largely due to a few, very large, Technology stocks. While investors have enjoyed this ride, they must also recognize the concentration risk that has accumulated in certain investments.

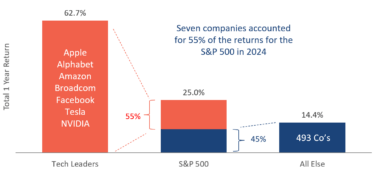
Quantifying the thin market leadership, we find that just seven companies in the S&P 500 accounted for 55% of the total return of the index. The remaining 493 stocks in the index accounted for the remaining 45%. While those seven stocks were up an average of 63%, the rest of the market was up “just” 14%.

It is notable that the last time the S&P 500 was up over 20% two years in a row was 1998 and 1999. In the two decades that followed that stretch, the S&P 500 Equal Weight Index outperformed the S&P 500 Index by an average of 3.2% per year. It is perhaps obvious from the name, but the equal weight index owns all 500 companies equally, while the standard index weights them by market cap (contributing to high concentrations of very large companies). History does not repeat, but it often rhymes and as such we would caution against purely market cap weighted exposure.

Chart 3: US Equities Advance With Thin Leadership

Chart 2

Source: Factset, S&P 500 index total return

Apparent high valuations are also influenced by a select few stocks

As we exit 2024, US equity valuations appear high on the surface. However, digging a bit deeper, we still see large pockets of fair value.

Looking at the Price-to-Earnings (PE) ratio of the S&P 500, using last 12 months earnings, we see a ratio of 27.1x. That compares to the 25-year average of the index at just 18.1x. Once again, we see the oversized effects of mega-cap Technology companies. Here are a few examples of high valuation metrics: Apple (37.5x), Microsoft (35.5x), Amazon (39.9x), Nvidia (55.8x) and Tesla (71.7x).

By comparison, if we look at the PE ratio of the equal-weight version of the S&P 500, it is just 19.8x. That is still a premium to its long-term average of 16.8x, but much closer to its fair value.

Once again, we see the case against market cap-weighted indexes. For our core portfolio holdings, we much prefer indexes that are weighted on inputs other than market cap. We call these factors, which include: high quality, good value, smaller size, and positive price momentum. The equal-weight variety of the S&P 500 is an example of an index that captures the “smaller size” factor.

Chart 4: Valuations Not High Everywhere

Chart 4

Source: Factset, PE Ratio (last twelve months)

Gold ended the year as the top performer, outpacing US Large Cap

We wrap up our review of the fourth quarter of 2024 with a snapshot of performance across asset classes. For the second year in a row, asset performance was decidedly positive.

As good as a year as US Large Cap equities had, it was Gold that held on as the best performing asset class this year. While the US economy remained strong in 2024, economic uncertainty appeared to hang over investor’s heads. A consequential Presidential election provided additional uncertainty. Both of these dynamics stimulated demand for an asset that is traditionally considered a store of value. Our strategies were overweight Gold due in part to this heightened uncertainty. In addition, Gold demand was elevated by central bank stockpiling globally.

US Large Cap equities were up over 20% for the second year in a row. As discussed, the S&P 500 was powered by a handful of mega-cap stocks. Not to be outdone, our preferred core US Large Cap multifactor fund (LRGF) outperformed the S&P 500 by 1.6%.

Small Cap and International stocks were positive. All-else equal, they produced attractive returns. But all-else was not equal, as they significantly lagged US Large Cap. Small-Cap, in particular, was hit by the more hawkish Fed outlook, as these companies tend to be more sensitive to lending rates.

While 2024 was an excellent year for returns overall, most assets slipped or were roughly flat in in the fourth quarter as investors digested significant past performance and the Fed digested the uncertain implications of the election outcome.

Chart 5: 2024 Asset Class Performance

Chart 5

Source: Factset

In a year that seems destined to be dominated by shiny objects, this quote seems appropriate:

“Investing should be more like watching paint dry or watching grass grow. If you want excitement, take $800 and go to Las Vegas.” — Paul Samuelson

The 2025 Playbook

As we usher in 2025, it’s a fitting moment to reflect on the year that lies ahead. No, we are not about to bore you with predictions of the future that are impossible to know (like, if stocks will be up or down on the year). Nor will we waste your time making predictions that will almost certainly come true (like, stocks will be both up and down significantly during the year). Rather, we will share some guidance on how to approach what is likely to be an interesting year for investors (but aren’t they all?).

The past two years have seen US equities rise by over 20% per year, driven primarily by a select few mega-cap tech stocks. In addition, we have a new administration promising to make sweeping changes to the way we do business as a nation. Within this backdrop we see many investors falling into one of two mindsets: reckless enthusiasm or irrational fear.

Reckless Enthusiasm

Let’s tackle the enthusiasts first. Chasing shiny objects can be fun, if you have some play money. But it is not sound investing. There will always be stories about your friend or neighbor who got rich buying a ridiculous digital token. Good for them! But, over time, the backing of earnings and assets matter, and buyers of shiny objects will be more likely find themselves rolling in disappointment than dough. Some examples of these shiny objects include:

  • Meme stocks – yes they’re still around
  • Cryptocurrencies
  • Stocks that randomly paste an AI onto their name
  • MicroStrategy (and even worse, levered MicroStrategy ETFs)
  • Triple-levered anything

We’ve even seen a lot of trend-chasing lately in more conventional spaces, like: weight loss drugs, quantum computing, and electric vehicles. There are future earnings to come in these spaces, but investors have been overshooting in these buoyant and exhuberant markets. The rush toward illiquid private investments, particularly credit, is equally concerning.

Irrational Fear

On the other side of the coin are the investors who are ready to run for the hills. They want to pile into cash and gold. They are afraid of high valuations, or the new administration, or both, and want to de-risk their portfolios. In most cases, this is pure market timing, and in the absence of luck, they will get the timing wrong. The trick with market timing is that you have to be right very precisely twice: once on the way out of the market and once on the way back in. If you miss the high on the way out and the low on the way in by as little as a day, you may find yourself lagging a simple buy and hold strategy. Only the lucky can win the market timing game.

That is not to say that de-risking is never logical. Sometimes it is. If the recent market performance has put your financial plan in exceptional shape, and you wish to reduce your portfolio volatility permanently going forward, that is not market timing. You are simply making a long-term change in your allocation due to changing circumstances. But if your goal is to de-risk temporarily because you think the market is going to go down… then good luck! You’ll need it.

Following the Evidence

As evidence-based investors we do not fall into either of these camps. We are approaching the new year grounded by the facts we see on the ground. We’ll get into those facts in a minute, but first a reminder of some evidence-based best practices that apply in any year:

  • Start with a well-diversified portfolio. Large Cap, Small Cap, International, Emerging, Bonds, Treasuries, Factors, TIPS, Gold – for starters. Set your portfolio at the right level of risk for you and stick with it. Don’t play games with market timing.
  • Choose liquid, inexpensive securities. You should always know what you own, know what it is worth, and be able to sell it tomorrow if you need it.
  • Opportunistically rebalance. Systematically take advantage of the market volatility and uncertainty. They are friends, not foes, for the patient and prepared investor.

What evidence do we see on the ground and how are we reacting to it:

  • The economy is still in growth mode based on most of our cycle indicators. To continue to take advantage of this, we are overweight Momentum. Rather than chase fleeting shiny objects, we use Momentum funds to capitalize on more enduring trends.
  • US Large Cap indexes like the S&P 500 are increasingly expensive and face concentration risk. We are combating this with, 1) the use of multifactor funds, 2) diverting some of our Large Cap exposure to single factors like Momentum (mentioned above) and Size (using an equal-weight Large Cap fund).
  • Uncertainty is elevated, given the arrival of a new administration with dreams of sweeping changes. In response, we maintain our overweight to Gold, which has proven to be a good diversifier when paired with equities.
  • Credit spreads are tight. The market is currently not rewarding investors for taking credit risk, particularly in intermediate term bonds. We have shifted some of our credit exposure to Treasuries in response.

If none of the above sounds exciting, that’s good. It’s not supposed to. We understand the allure of novel investment opportunities that capture headlines and spark conversations. However, our commitment to our clients is rooted in evidence-based strategies that prioritize long-term financial health over short-term gains.

As we step into 2025, our focus remains true to the principles that have served our clients well. We don’t try to predict the future. We weigh the evidence and prepare accordingly. Time will tell if 2025 is another year for the record books, or a year investors would rather forget. Either way there will inevitably be turbulence, and we stand prepared to traverse it with calm. On behalf of the team here at Strategic, I thank our growing community of clients, friends, and family members for placing their trust in us. We deeply appreciate your partnership.

Signature

About Strategic

Founded in 1979, Strategic is a leading investment and wealth management firm managing and advising on total client assets of over $2 billion.

Overview

Disclosures

Strategic Financial Services, Inc. is registered with the Securities and Exchange Commission (SEC) as an Investment Advisor. The term “registered” signifies compliance with regulatory requirements and does not imply a certain level of skill or training.

The information provided on our website, including weekly market commentaries, financial planning articles, and other educational resources, is intended solely for educational purposes. It is designed to offer insights into financial planning and investment management, aiming to enhance understanding of financial concepts, strategies, and market trends. This content should not be interpreted as personalized investment advice or a recommendation for any specific strategy, financial planning approach, or investment product. Financial decisions are deeply personal and should be made considering the individual’s specific circumstances, goals, and risk tolerance. We recommend consulting with a professional financial advisor for personalized advice.

Please be aware that Strategic Financial Services, Inc. does not provide legal or tax advice. The content on this website is not intended to be used as such or as a substitute for legal or tax advice from a licensed professional. We advise seeking guidance from qualified legal and tax advisors regarding these matters.
Investment Risks and Portfolio Management.

The discussion of any investments on this website is for illustrative purposes only and provides no guarantee that the advisor will make any investments with the same or similar characteristics as those presented. The investments identified and described herein do not represent all the investments purchased or sold for client accounts. The selection of representative investments to discuss is based on various factors, including recent company news or earnings releases.

It should not be assumed that any investments discussed were or will be profitable. All investments involve risk, including the potential loss of principal. There is no assurance that investments mentioned will remain in client accounts at the time you view this information.

When index returns are mentioned on this site, they are provided as a general indicator of market conditions and are not representative of any client’s portfolio performance. Indices are unmanaged, do not incur management fees, costs, and expenses, and cannot be invested in directly. Therefore, their performance does not reflect the expenses associated with the management of an actual portfolio.

While index returns are used as a framework to report on general market conditions, they should not be construed as an indicator of future performance of any specific investment or portfolio. Discussion of index returns is intended to provide context and insight, not to suggest that clients will achieve similar results. Each client’s portfolio is managed according to their specific investment goals and financial situation.

The opinions and any forward-looking statements expressed in the articles and videos featured in our resource center are as of the date of publication. These statements are based on current laws, regulations, market conditions, and other relevant factors, including third-party data. Given the dynamic nature of financial and regulatory environments, as well as potential changes in market conditions or economic circumstances, the information provided may become outdated or may no longer be accurate.
We rely on third-party data to form our opinions and projections, which means that these are subject to the same uncertainties that affect all data-dependent analyses. As such, we advise readers to exercise caution and not rely solely on the statements made herein for making financial decisions. It is recommended that investors consult with a professional advisor who can help assess the relevance and accuracy of the content in light of the current economic climate and personal financial situation.

Our website contains links to third-party websites as a convenience to our users. Strategic Financial Services, Inc. does not control, endorse, or guarantee the content found on such sites. We are not responsible for the accuracy, legality, or content of the external site or for that of subsequent links.
Contact the external site for answers to questions regarding its content.
The inclusion of any link does not imply our endorsement of the site, nor does it imply any association with its operators. Use of any such linked website is at the user’s own risk.

Related Resources