A market under no obligation to make sense

The third quarter of the year picked up where the second left off, with equities continuing to rally, hitting fresh all-time highs. A rate cut—and talk of more cuts—helped boost Small Cap stocks, which had previously lagged. But perhaps the defining feature this year has been the weakness of the US dollar juxtaposed with the strength of gold. The two moves are somewhat related and provide a real-life example of why a truly well-diversified portfolio, free from the trappings of home bias, is so important.
The Fed cut rates for the first time in over a year
After over a year of waiting, the Fed cut interest rates by 25 basis points in September, and an additional cut is expected before year-end. Inflation continues to be a thorn in the Fed’s side and has been the primary cause of the delay. Inflation has faced upward pressure from tariffs, tightened immigration policies, and tax relief. As a result, inflation has remained rangebound, hovering between 2.5% and 3%.
The Fed would prefer inflation closer to 2%, but its dual mandate requires balancing inflation and employment. Recent employment data has shown signs of weakness, despite an otherwise buoyant economy. Rate cuts take time to influence economic activity, and with this cut, the Fed aims to avoid falling behind the curve.
Chart 1: Rate cuts have begun


Source: The US Federal Reserve, Bureau of Economic Analysis
First-half Small Cap weakness has begun to reverse
US Small Cap stocks lagged their Large Cap peers meaningfully in the first half (and for the better part of the past five years for that matter). Large Cap performance has been driven by the Magnificent Seven (or Eight perhaps?) as the Technology giants have outpaced the rest of the market.
That trend paused in Q3 as Small Cap stocks outperformed. One likely driver is the recent rate cut as well as talk of additional cuts to come. A reduction in interest rates has the potential to benefit smaller companies proportionally more than larger ones. Smaller companies are more likely to rely on shorter-term debt funding, and floating-rate debt. As a result, when rates fall, these small companies have the potential to benefit proportionally more from the cheaper, short-term funding.
Time will tell if future rate cuts materialize, and if they can sustain Small Cap’s third-quarter performance trends.
Chart 2: Cuts have benefited Small Cap stocks


Source: S&P 500 (large cap), S&P 600 (small cap)
All-time highs, and valuation concerns
There have been a number of headlines about the number of all-time highs in equity markets this year. All-time highs are typical in healthy markets, so are not in themselves any cause for concern. The US equity market has a history of going up more than it goes down (that’s why we invest in it) and a natural result should be frequent all-time highs. But valuation is important as well.
A look across equity markets shows US Large Cap stocks stand out, trading at a notable premium to their pre-Covid median. We looked at the decade before Covid and found that the S&P 500 trailing 12-month Price-to-Earnings (PE) ratio is currently at a 63% premium to its median. But it is fairly unique in this respect.
By comparison, the equal weight version of the S&P 500 is trading at only a 25% premium. The reason is that this variation is less impacted by the expensive Mega Cap Tech stocks which dominate the S&P 500. Perhaps more striking is that the S&P 600 (Small Cap) trades at just a 5% premium to its historical median.
So, is this a moment to exit US Large Cap? Not necessarily. Markets can remain ‘expensive’ for extended periods. Alan Greenspan famously coined ‘irrational exuberance’ in 1996, years before the market eventually peaked. And in contrast to the dot-com bubble, today’s ‘expensive’ tech companies generally are highly profitable. In our opinion, proper diversification—rather than market timing—is a better approach. That holds true whether the US market is expensive or not.
Chart 3: US Large Cap appears uniquely expensive
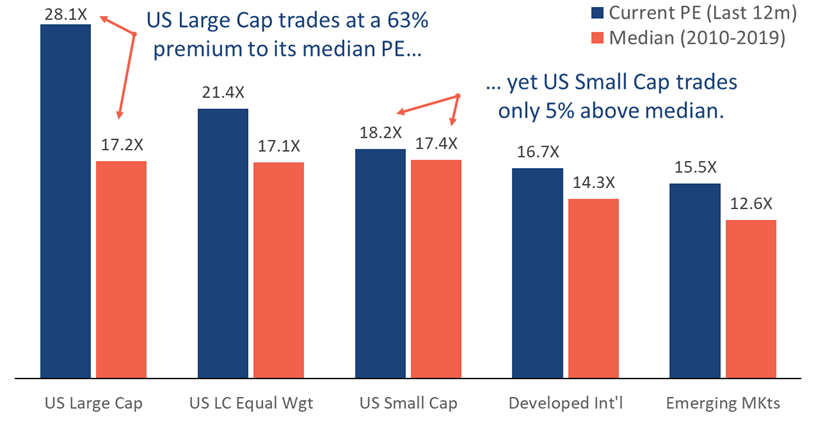

Source: LTM PE of S&P 500 index, S&P 500 Eq Wt Index, S&P 600 Small Cap Index, MSCI EAFE, MSCI EM
US dollar weakness overshadowed by Gold’s strength
The weakness in the US dollar was a defining feature of the first three quarters of 2025, but it was overshadowed by gold’s continued strength. The two moves are intertwined.
The US dollar has declined about 10% versus a basket of global currencies thus far this year. The weakness stems, in part, from a rising fiscal deficit, policy uncertainty, and expected Fed rate cuts. The implications have been felt most notably in international investments. Both developed and emerging market stocks significantly outperformed US stocks through September. Part of that relative performance is directly attributable to dollar weakness.
Gold, on the other hand, has continued to perform strongly. Demand for gold has increased, in part, due to the weak dollar, rate cuts, global central bank buying, and its role as a safe haven in uncertain times.
A well-diversified portfolio, with exposure to international markets and commodities like gold, has the potential to capitalize on both these trends.
Chart 4: Dollar weakness and gold strength
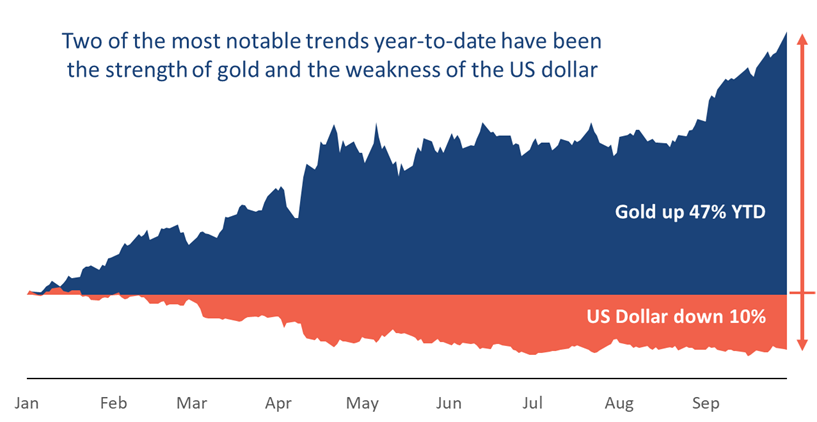

Source: ICE US Dollar, Gold New York Spot
Gold and international strong amid a weak US dollar and tariff uncertainty
US Large Cap has had an excellent year so far, but diversifiers have been the star performers in 2025. Here are the highlights:
- As discussed above, gold is the standout performer, up 47%, thanks in part to the weak dollar, rate cuts, global central bank buying, and its continued perception as a store of value in volatile times.
- International stocks significantly outperformed domestic stocks, helped by better valuations and currency effects.
- Despite a solid Q3 as rates come down, tariff fears held back US Small Cap stocks. While the S&P 600, shown below, is up only 4% on the year, another broad Small Cap index—the Russell 2000, is up over 10%.
- US bonds produced positive returns, providing portfolios with both stability and income.
Chart 5: Year-to-date 2025 asset class roundup


Source: Factset
“The universe is under no obligation to make sense to you.” – Neil deGrasse Tyson
As we exit the third quarter with multiple asset classes at or near all-time highs, the question on many investors’ minds is: “Can it continue?” It can… but it is under no obligation to.
Making sense of a market determined to rise
In my free time, I often indulge my inner engineering nerd—whether it’s tackling DIY renovations or tuning into StarTalk with Neil deGrasse Tyson. If you listen to Neil long enough, you’ll hear him say, “The universe is under no obligation to make sense to you.” It’s a reminder of how complex systems—like the cosmos or the capital markets—can behave in ways that defy our expectations.
It may seem logical to sell when markets reach all-time highs. But history tells a different story. Momentum is a powerful force. What goes up often continues to go up—at least for a time. All-time highs are not rare, and they are not a signal to retreat. They are simply part of the market’s natural rhythm.
Eventually, we will experience another pullback, correction, or bear market. That, too, is normal. The key is preparation—not prediction. Now is a good time to ensure that the remarkable strength of US Large Cap stocks—especially the surging Mega Cap Technology names—hasn’t quietly overwhelmed your portfolio over the past five years.
Our evidence-based approach helps clients maintain well-diversified portfolios that avoid common pitfalls like home bias and concentration risk. While we continuously evaluate the data to guide our tactical positioning, our current approach includes:
- Diversifying across international equities, bonds, gold, emerging markets, and small caps
- Tilting toward areas with historical strength in similar environments, such as momentum stocks and gold
- Avoiding speculative assets and trend chasing, especially those with high risk of permanent loss
- Resisting emotional market timing
- Staying ready with sophisticated trading systems to: 1) systematically sell high and buy low as markets fluctuate, and 2) act swiftly to capitalize on major market moves
Each of these steps is designed to incrementally tip the odds in favor of our clients. The consistent and disciplined pursuit of these small advantages is what we call evidence-based investing. It’s the foundation of our philosophy—and our preferred approach in uncertain times.
As we look ahead to the final quarter of the year, I want to thank our clients, friends, and families who have joined the Strategic community and placed their trust in us. The future is always uncertain, but we’re honored to face it together.


About Strategic
Founded in 1979, Strategic is a leading investment and wealth management firm managing and advising on total client assets of over $2.5 billion.
Disclosures
Strategic Financial Services, Inc. is registered with the Securities and Exchange Commission (SEC) as an Investment Advisor. The term “registered” signifies compliance with regulatory requirements and does not imply a certain level of skill or training.
The information provided on our website, including weekly market commentaries, financial planning articles, and other educational resources, is intended solely for educational purposes. It is designed to offer insights into financial planning and investment management, aiming to enhance understanding of financial concepts, strategies, and market trends. This content should not be interpreted as personalized investment advice or a recommendation for any specific strategy, financial planning approach, or investment product. Financial decisions are deeply personal and should be made considering the individual’s specific circumstances, goals, and risk tolerance. We recommend consulting with a professional financial advisor for personalized advice.
Please be aware that Strategic Financial Services, Inc. does not provide legal or tax advice. The content on this website is not intended to be used as such or as a substitute for legal or tax advice from a licensed professional. We advise seeking guidance from qualified legal and tax advisors regarding these matters.
Investment Risks and Portfolio Management.
The discussion of any investments on this website is for illustrative purposes only and provides no guarantee that the advisor will make any investments with the same or similar characteristics as those presented. The investments identified and described herein do not represent all the investments purchased or sold for client accounts. The selection of representative investments to discuss is based on various factors, including recent company news or earnings releases.
It should not be assumed that any investments discussed were or will be profitable. All investments involve risk, including the potential loss of principal. There is no assurance that investments mentioned will remain in client accounts at the time you view this information.
When index returns are mentioned on this site, they are provided as a general indicator of market conditions and are not representative of any client’s portfolio performance. Indices are unmanaged, do not incur management fees, costs, and expenses, and cannot be invested in directly. Therefore, their performance does not reflect the expenses associated with the management of an actual portfolio.
While index returns are used as a framework to report on general market conditions, they should not be construed as an indicator of future performance of any specific investment or portfolio. Discussion of index returns is intended to provide context and insight, not to suggest that clients will achieve similar results. Each client’s portfolio is managed according to their specific investment goals and financial situation.
The opinions and any forward-looking statements expressed in the articles and videos featured in our resource center are as of the date of publication. These statements are based on current laws, regulations, market conditions, and other relevant factors, including third-party data. Given the dynamic nature of financial and regulatory environments, as well as potential changes in market conditions or economic circumstances, the information provided may become outdated or may no longer be accurate.
We rely on third-party data to form our opinions and projections, which means that these are subject to the same uncertainties that affect all data-dependent analyses. As such, we advise readers to exercise caution and not rely solely on the statements made herein for making financial decisions. It is recommended that investors consult with a professional advisor who can help assess the relevance and accuracy of the content in light of the current economic climate and personal financial situation.
Our website contains links to third-party websites as a convenience to our users. Strategic Financial Services, Inc. does not control, endorse, or guarantee the content found on such sites. We are not responsible for the accuracy, legality, or content of the external site or for that of subsequent links.
Contact the external site for answers to questions regarding its content.
The inclusion of any link does not imply our endorsement of the site, nor does it imply any association with its operators. Use of any such linked website is at the user’s own risk.