A Mid-Term Gut Check

Contributed by Doug Walters, Max Berkovich, David Lemire, Eh Ka Paw
Investors are approaching the upcoming mid-term elections with anxious anticipation. The recent rally has likely helped to reduce trepidation. But based on questions we are getting from clients, there is still some concern about how the election results will impact their investments. If history is any guide, they should not be overly worried.
Historically there is no correlation between the party in charge and stock market returns. The US stock market generally goes up over time. Why? Companies are adaptable. The stock market reflects the fortunes of all public companies. These companies are good at adapting and finding a path to profitability regardless of the nuance from one administration to the next. We showed this in Chart 5 of our Q3 2020 Perspectives.
A chart we first introduced during the 2018 midterm elections is perhaps more intriguing for today. The chart looks at stock market performance in the six-month period from November through April in mid-term election years versus Presidential election years. The data goes back to 1930 and shows that months during and after a mid-term election tend to be strong for stock investors. Great! While we like the implications of the chart, as evidence-based investors, we must say that this is not very robust evidence. Yes, the data goes back to 1930, a long time, but that only equates to 23 elections. So still a small sample set.
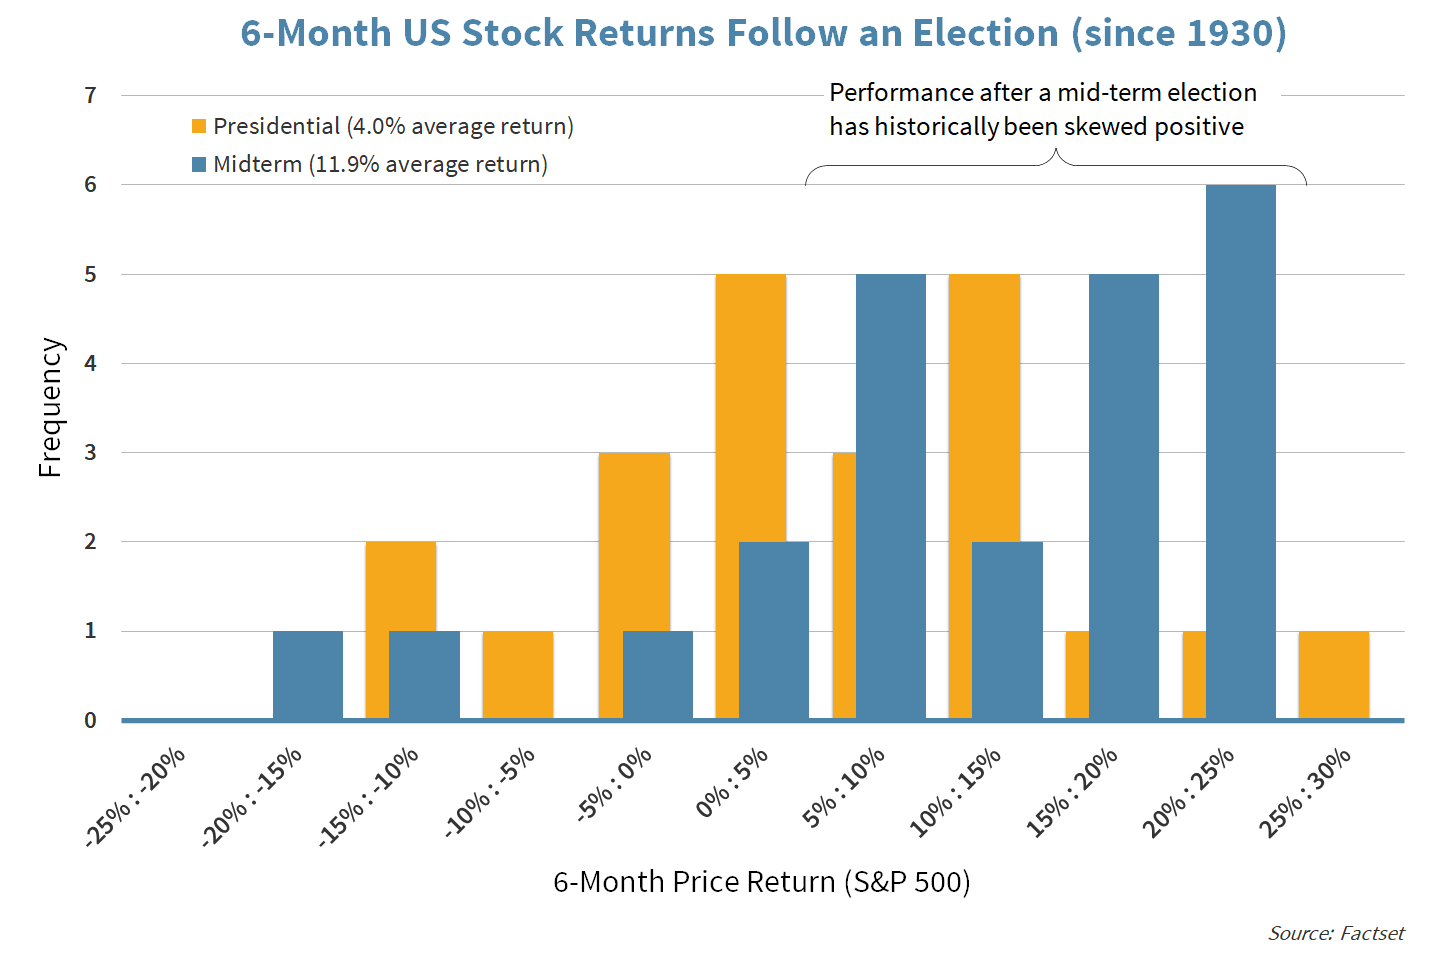
We show this data not as a prediction that the next six months will be strong but rather to remind investors that as challenging as the current environment feels, the stock market tends to go up, and a mid-term year is as good as any to start the next rally.
The outperformance of Value versus Growth in 2022
The Russell 1000 Value index (down -10.4%) has significantly outperformed the Russell 1000 Growth index (down -26.5%) so far this year.
Stocks ended the week definitively in positive territory despite big misses from some of the market’s heavy hitters, namely Microsoft (MSFT), Alphabet (GOOGL), and, most notably, Amazon (AMZN). The online retailer was down almost 15% on the week. The positive market move gives us our headline of the week.
- The Russell 1000 (US large cap) was up over 2% on Friday and ended the week up over 4%.
- It has been an excellent start to Q4, with US large and small caps up nearly 9% and 11%, respectively.
- The factors leading the market higher are Value and Momentum stocks. Value (VLUE) is up around 14%, while Momentum (MTUM) is up nearly 13%.
Value investors have had to be patient in recent years as growth stocks have been dominant. Recently their patience has been rewarded. Year-to-date, the Russell 1000 Value index is down -10.5%. That may not seem impressive, but the Russell 1000 Growth index is down -26.5%. Outperforming in a downturn is a good recipe for long-term investing success.

About Strategic
Founded in 1979, Strategic is a leading investment and wealth management firm managing and advising on total client assets of over $2 billion.
Disclosures
Strategic Financial Services, Inc. is registered with the Securities and Exchange Commission (SEC) as an Investment Advisor. The term “registered” signifies compliance with regulatory requirements and does not imply a certain level of skill or training.
The information provided on our website, including weekly market commentaries, financial planning articles, and other educational resources, is intended solely for educational purposes. It is designed to offer insights into financial planning and investment management, aiming to enhance understanding of financial concepts, strategies, and market trends. This content should not be interpreted as personalized investment advice or a recommendation for any specific strategy, financial planning approach, or investment product. Financial decisions are deeply personal and should be made considering the individual’s specific circumstances, goals, and risk tolerance. We recommend consulting with a professional financial advisor for personalized advice.
Please be aware that Strategic Financial Services, Inc. does not provide legal or tax advice. The content on this website is not intended to be used as such or as a substitute for legal or tax advice from a licensed professional. We advise seeking guidance from qualified legal and tax advisors regarding these matters.
Investment Risks and Portfolio Management.
The discussion of any investments on this website is for illustrative purposes only and provides no guarantee that the advisor will make any investments with the same or similar characteristics as those presented. The investments identified and described herein do not represent all the investments purchased or sold for client accounts. The selection of representative investments to discuss is based on various factors, including recent company news or earnings releases.
It should not be assumed that any investments discussed were or will be profitable. All investments involve risk, including the potential loss of principal. There is no assurance that investments mentioned will remain in client accounts at the time you view this information.
When index returns are mentioned on this site, they are provided as a general indicator of market conditions and are not representative of any client’s portfolio performance. Indices are unmanaged, do not incur management fees, costs, and expenses, and cannot be invested in directly. Therefore, their performance does not reflect the expenses associated with the management of an actual portfolio.
While index returns are used as a framework to report on general market conditions, they should not be construed as an indicator of future performance of any specific investment or portfolio. Discussion of index returns is intended to provide context and insight, not to suggest that clients will achieve similar results. Each client’s portfolio is managed according to their specific investment goals and financial situation.
The opinions and any forward-looking statements expressed in the articles and videos featured in our resource center are as of the date of publication. These statements are based on current laws, regulations, market conditions, and other relevant factors, including third-party data. Given the dynamic nature of financial and regulatory environments, as well as potential changes in market conditions or economic circumstances, the information provided may become outdated or may no longer be accurate.
We rely on third-party data to form our opinions and projections, which means that these are subject to the same uncertainties that affect all data-dependent analyses. As such, we advise readers to exercise caution and not rely solely on the statements made herein for making financial decisions. It is recommended that investors consult with a professional advisor who can help assess the relevance and accuracy of the content in light of the current economic climate and personal financial situation.
Our website contains links to third-party websites as a convenience to our users. Strategic Financial Services, Inc. does not control, endorse, or guarantee the content found on such sites. We are not responsible for the accuracy, legality, or content of the external site or for that of subsequent links.
Contact the external site for answers to questions regarding its content.
The inclusion of any link does not imply our endorsement of the site, nor does it imply any association with its operators. Use of any such linked website is at the user’s own risk.