Value vs. Growth
 Doug Walters
Comparing the risk and return characteristics of Growth and Value stock strategies with an eye on portfolio construction.
Defining Value and Growth
Before we begin comparing Growth and Value, it is important to understand what these terms mean in practice. At a high level, we would define each as follows:
| Value Stocks: | Fundamentals support a higher value than the market is currently pricing in. |
| Growth Stocks: | Future earnings are expected to grow at an above average rate. |
However, these definitions face immediate problems in the real world:
- They are not mutually exclusive. Clearly it is conceivable to have a stock with above average earnings growth potential, yet have a valuation which does not reflect this outlook.
- There is no mention of valuation in the definition of Growth Stocks.
- Future earnings growth is a subjective measure, so one investor’s Growth stock could be another’s laggard.
- Valuation is also subjective, as separate investors may focus on different fundamental measures and valuation techniques. Is it value or is it a value trap?
Indexes “solve” these issues by formulaically splitting stocks into either Growth or Value buckets. For this study, we are using the Dow Jones US Total Stock Market Index. To classify the stocks as Growth or Value Dow Jones uses: three growth measures; two valuation measures; and dividend yield. We can summarize the average characteristics of these two buckets as follows:
| Value Stocks in Index: | Low earnings/revenue growth; cheap valuation; high dividend yield |
| Growth Stocks in Index: | High earnings/revenue growth; expensive valuation; low dividend yield |
The difference between this definition used by indices and the definition we started with is significant. Stocks in the “Value” index could have a low valuation for very good reason (eg. poor earnings outlook). We call these value traps. Likewise, stocks in the “Growth” index may simply be massively overvalued. With passive index tracking Exchange Traded Funds (ETFs) more popular than ever, it is important for investors in these vehicles to be aware of what they are gaining exposure to. Even an active manager who rigidly benchmarks themselves to one of these indices may be subject to the same pitfalls.
Calculating the Performance
We look at performance from the beginning of 1980 to the end of 2014 to see if there is a material difference between the historical returns of Value and Growth stocks. There are six categories of stocks included in our study:
- Large Cap Value and Growth
- Mid Cap Value and Growth
- Small Cap Value and Growth
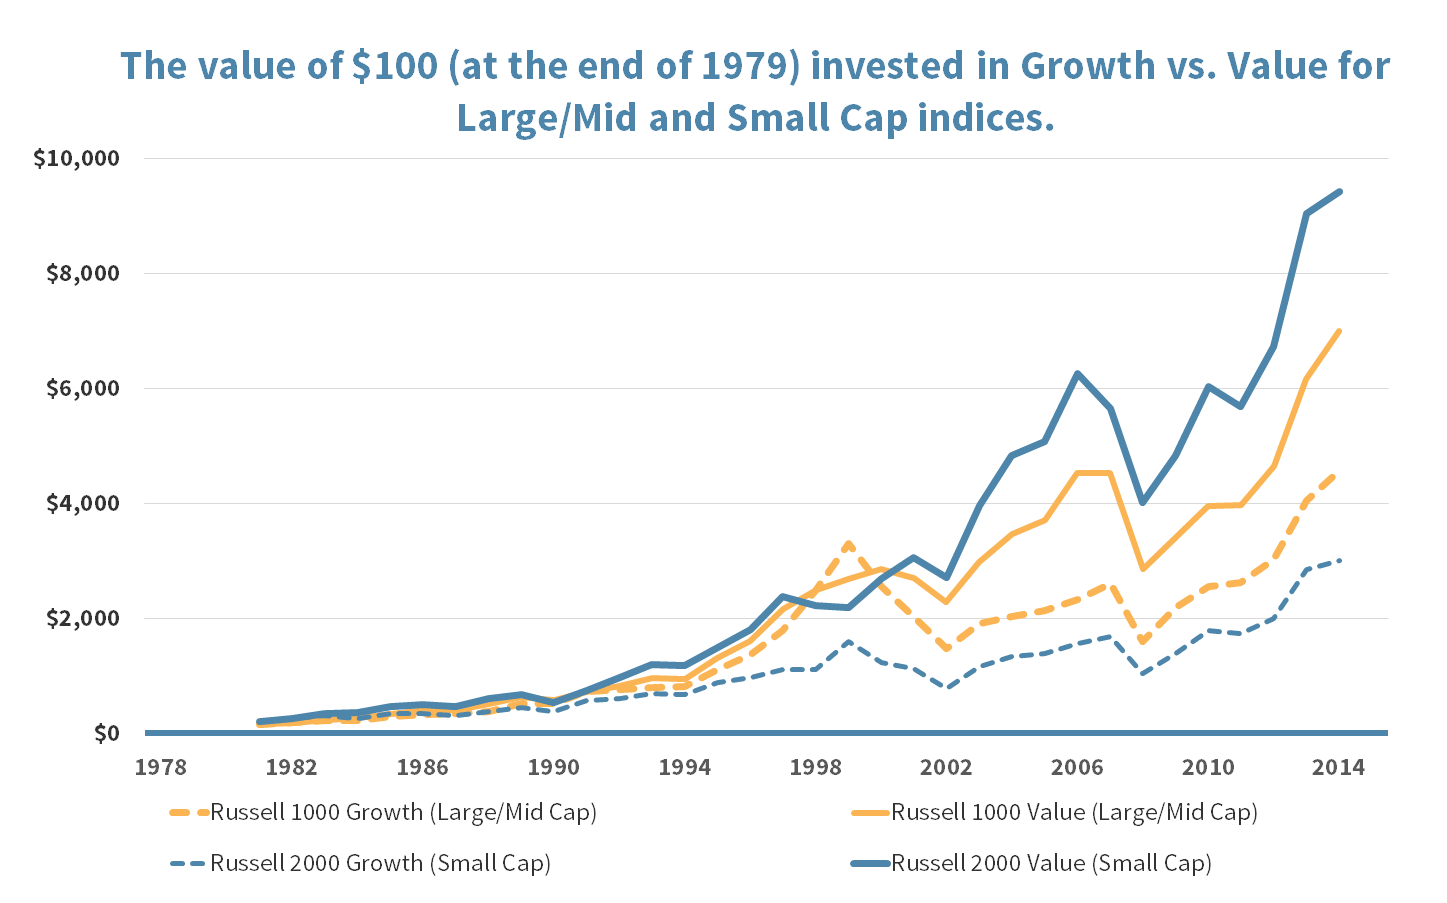
Figure 1 shows how a $100 investment at the beginning of 1979 would have grown over time. For each size class (Large/Mid and Small), the Value version of the index outperformed Growth.
FIGURE 1: Comparing investment performance of Value and Growth indices
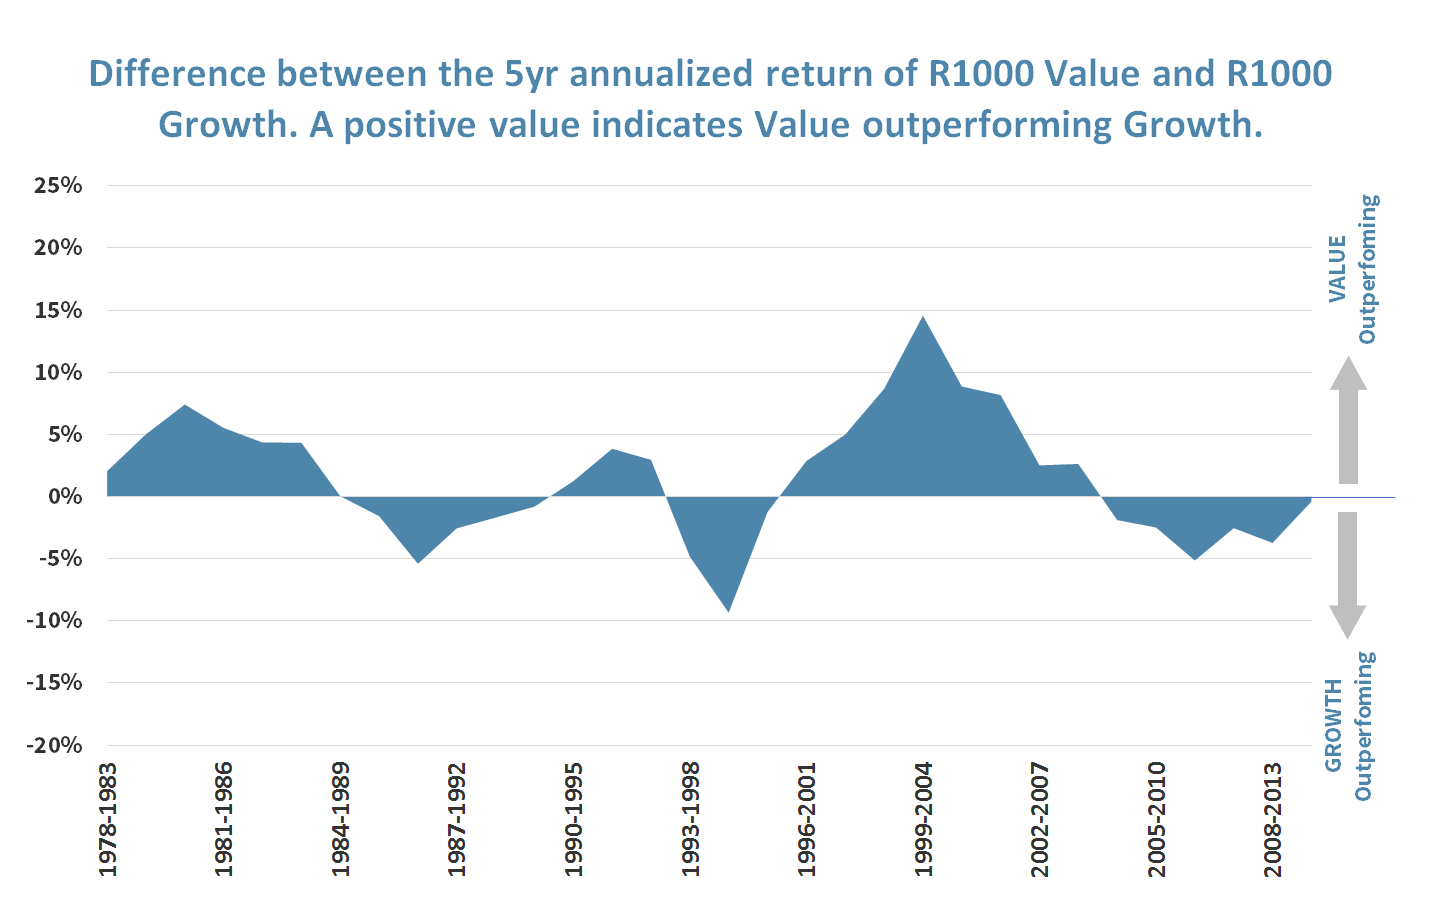
Zooming in on the Large Cap data, we calculate the annualized excess return achieved in Value vs. Growth over rolling five year periods. Each point on the chart below represents a five year period. For these five year periods, Value outperforms Growth about 56% of the time.
FIGURE 2: Annualized relative performance of Large Cap Value compared to Growth over 5 year rolling periods
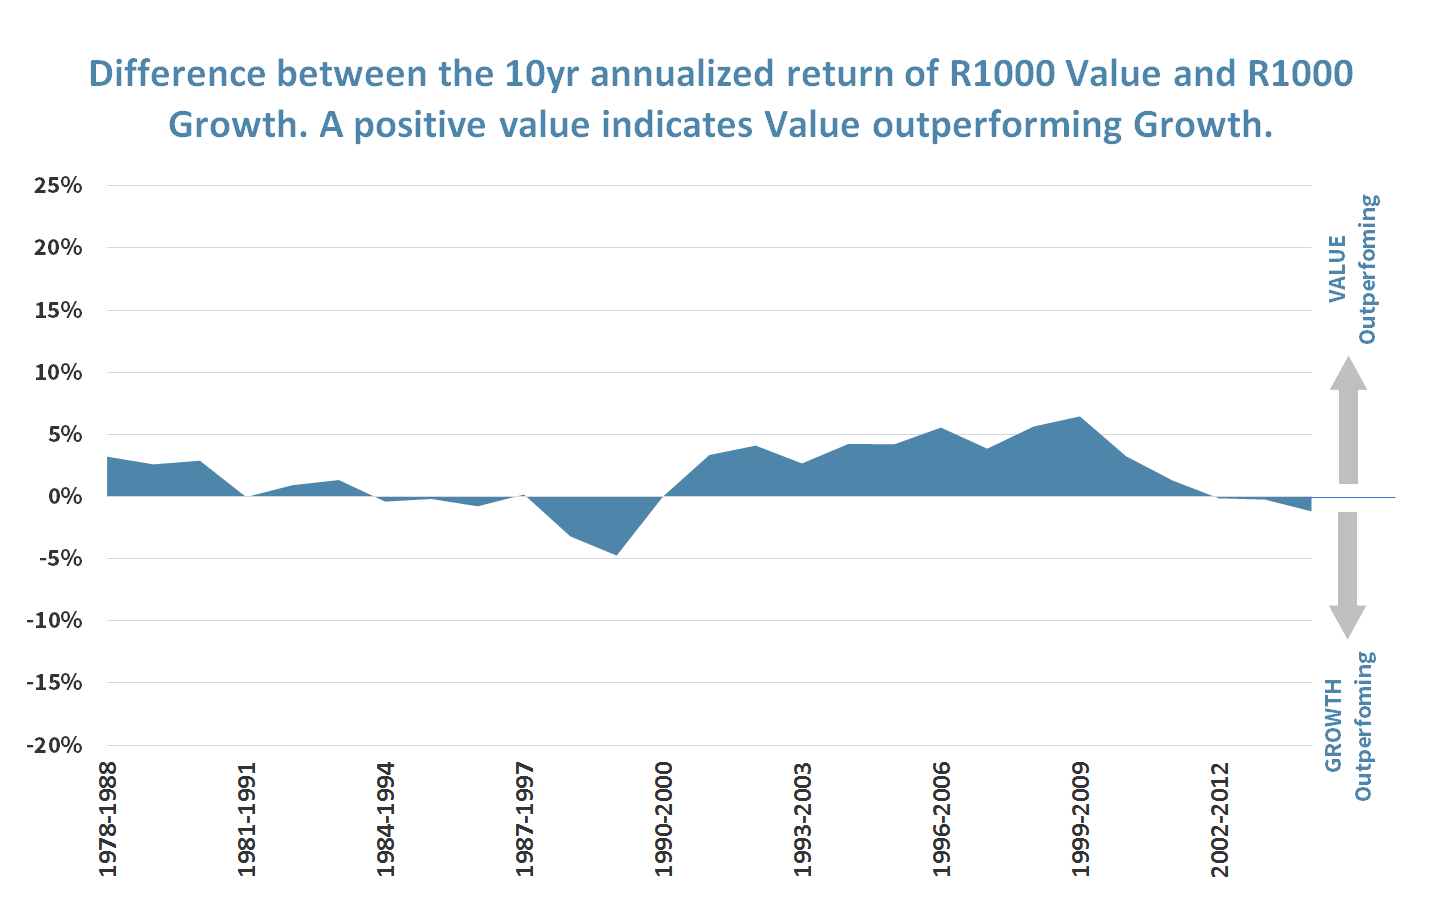
If we instead look at 10 year rolling periods, we see an even more pronounced difference between Value and Growth. Figure 3 shows that Value outperforms Growth about 67% of the time over 10 years.
FIGURE 3: Annualized relative performance of Large Cap Value compared to Growth over 10 year rolling periods
Factoring in Risk
The traditional risk metric for equities is volatility. However, at Strategic, we feel strongly that the ability and willingness of a client to take risk includes multiple objective and subjective measures. Factors such as tracking error, shortfall, permanent loss of capital, costs, currency exposure and donor wishes (where applicable) should be considered. With that said, for our purposes here, we will focus on the traditional risk measure of volatility.
The ideal investment has a high average return and low volatility. We have already seen that the average return of Value stocks has exceeded that of Growth stocks over the past 35 years. The data below shows that Value has also offered lower volatility. In other words, Value investors over the past three and a half decades have enjoyed both higher returns and lower risk (at least as measured by volatility).
| Average Total Return | Annual Volatility* | |
|---|---|---|
| Value | 13.7% | 15.7% |
| Growth | 13.2 | 20.4 |
*Annual volatility is calculated as the standard deviation of the annual returns around the mean.
Implications: Should We Only Invest in Value?
The short answer is no, and there are a number of reasons for this, including:
- Value does not always outperform Growth. While we do not promote market timing per se, there are times when we would favor growth on relative valuation.
- This comparison ignores the benefits of diversification. Proper diversification can reduce overall portfolio risk.
- We can invest in Growth without following the index’s definition of growth. Our aim with our Growth strategies is to identify growth companies where the full extent of the expected growth is not priced in (ie. Growth at a Reasonable Price).
- Historical average returns may not repeat in the future.
While we would not promote ignoring Growth stocks altogether, we would caution against an all-Growth index strategy for most investors. Many risk tolerant investors believe the best strategy for them is pure Growth – as it is commonly viewed as a higher-risk / higher-return approach. The historical data disputes this belief. Yes, Growth has proven to be higher risk in the past, but it has also proven to generate lower returns.
Our Approach to Value and Growth
Our goal is to offer our clients an equity strategy that capitalizes on the positive returns that equities have historically offered, while maintaining an appropriate level of risk. We do not view risk as merely volatility. Rather, as noted earlier, we also consider factors such as tracking error, shortfall, permanent loss of capital, costs, currency exposure and donor wishes (where applicable).
We have two core equity strategies: Equity Income and Strategic Growth. These are differentiated from the Value and Growth index trackers as follows:
- Benchmarking: Strategic does not manage to benchmarks, as that practice can lead to the assumption of unintended risks. Rather, we use indices as one general reference point in evaluating our success in the pursuit of a client’s goals. This approach frees us from the trappings of strict benchmark adherence which can lead to underperformance.
- Quality: We view quality as essential to protecting and compounding client assets over the long-term regardless of whether we are building a portfolio of Value or Growth stocks. We determine quality by focusing on both quantitative metrics (eg. balance sheet strength and capital stewardship) as well as qualitative metrics (eg. strong management and defensible business model).
- Value: Value is found where the market price provides a reasonable margin of safety. This holds true for both Value and Growth stocks and is an important component of risk management. For our Strategic Growth portfolio, we seek secular growth stocks, where profits are being reinvested to perpetuate growth, and where that growth is not fully priced in. For our Equity Income portfolio, we look for stocks with an ability to grow their dividend, and where valuation is cheap relative to fundamentals.
- Diversification: For many clients, we recommend that their equity holdings contain an equal exposure to Value and Growth plus additional diversifiers (eg. International, Small Cap, Emerging Markets). While Value has outperformed Growth historically, there is no guarantee of that going forward, and we prefer to capitalize on the benefits of diversification.
Conclusion
Historically Value has outperformed Growth on both returns and risk metrics. Pure Growth investors should use caution. However, we do not believe that investors should shun Growth altogether. Rather, we would promote a balanced approach to Value and Growth for the average investor.
About Strategic
Founded in 1979, Strategic is a leading investment and wealth management firm managing and advising on client assets of over $2 billion.
OverviewDisclosures
Strategic Financial Services, Inc. is a SEC-registered investment advisor. The term “registered” does not imply a certain level of skill or training. “Registered” means the company has filed the necessary documentation to maintain registration as an investment advisor with the Securities and Exchange Commission.
The information contained on this site is for informational purposes and should not be considered investment advice or a recommendation of any particular security, strategy or investment product. Every client situation is different. Strategic manages customized portfolios that seek to properly reflect the particular risk and return objectives of each individual client. The discussion of any investments is for illustrative purposes only and there is no assurance that the adviser will make any investments with the same or similar characteristics as any investments presented. The investments identified and described do not represent all of the investments purchased or sold for client accounts. Any representative investments discussed were selected based on a number of factors including recent company news or earnings release. The reader should not assume that an investment identified was or will be profitable. All investments contain risk and may lose value. There is no assurance that any investments identified will remain in client accounts at the time you receive this document.
Some of the material presented is based upon forward-looking statements, information and opinions, including descriptions of anticipated market changes and expectations of future activity. Strategic Financial Services believes that such statements, information, and opinions are based upon reasonable estimates and assumptions. However, forward-looking statements, information and opinions are inherently uncertain and actual events or results may differ materially from those reflected in the forward-looking statements. Therefore, undue reliance should not be placed on such forward-looking statements, information and opinions.
No content on this website is intended to provide tax or legal advice. You are advised to seek advice on these matters from separately retained professionals.
All index returns, unless otherwise noted, are presented as price returns and have been obtained from Bloomberg. Indices are unmanaged and cannot be purchased directly by investors.