Uncharted Territory
 Doug Walters
In this edition of our quarterly Perspectives, we review the second quarter and provide a roadmap for navigating the uncharted territory of globally low interest rates and rising equity valuations.
Dissecting Q2 2017
Contributed by Doug Walters
In many respects, 2017 has been filled with volatility. We have seen unprecedented disruptions across multiple industries due to technology advances, with retail being the most notable example. The political landscape has rarely felt more uncertain. Yet, where we have not seen volatility is the U.S. stock market, with S&P 500 volatility near historical lows. Stocks continue to set new highs, pushing valuations to above average levels.
We sense investor angst rising. However, economic fundamentals are robust. Growth is positive, unemployment is low, and corporate earnings are continuing to improve. Investors are also factoring in a corporate-friendly administration, with expectations that tax reform and lower regulation will eventually come. Add to that the lack of attractive alternatives to equities, and it is no surprise that valuations are above average.
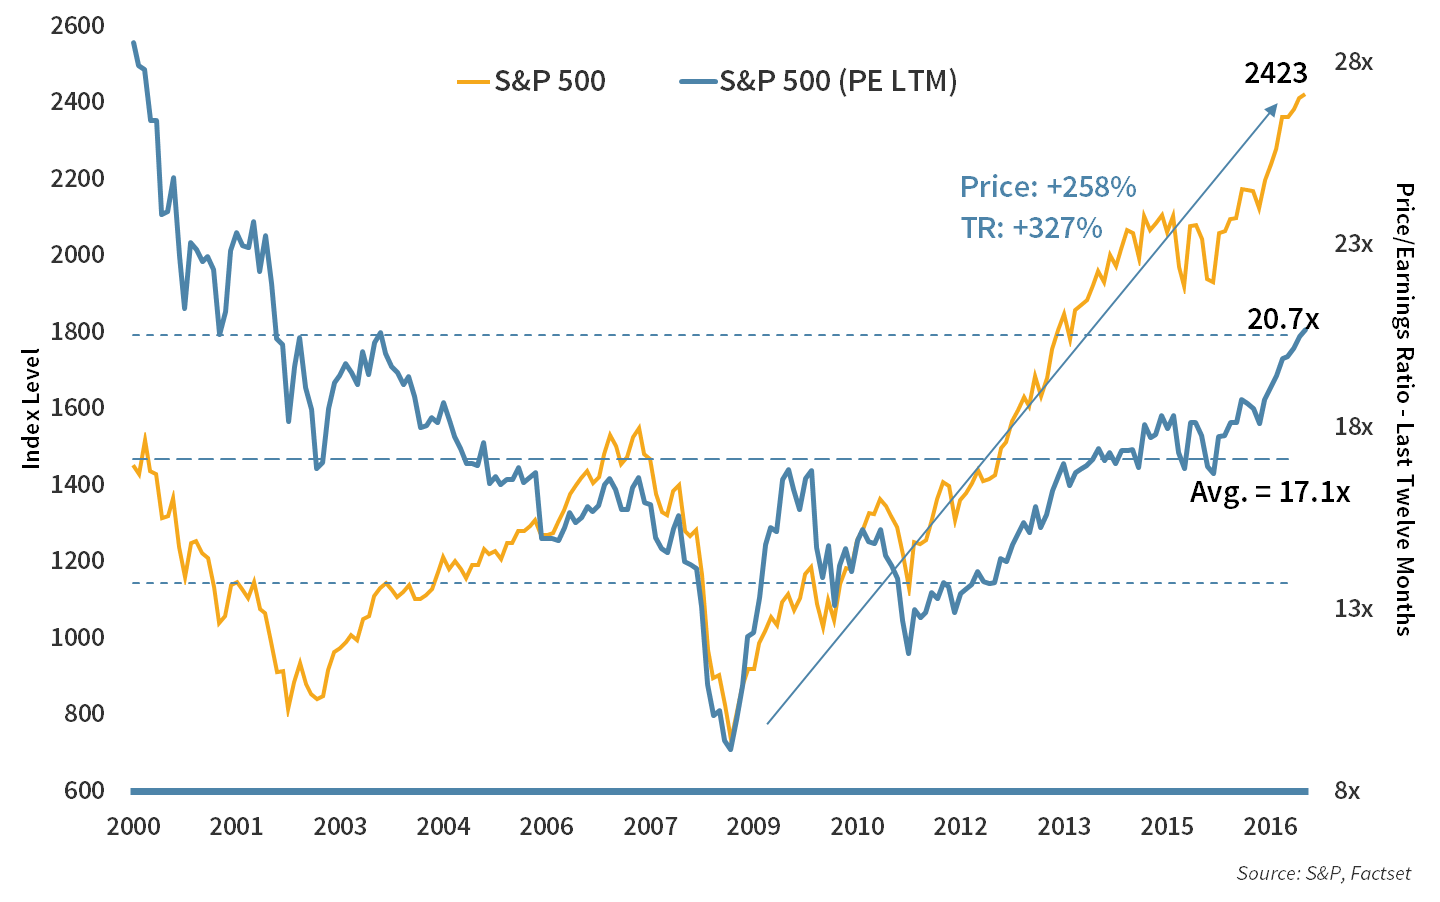
Chart 1: Equity Valuation
Equity valuations have stretched further this quarter. But we see support from improving fundamentals.
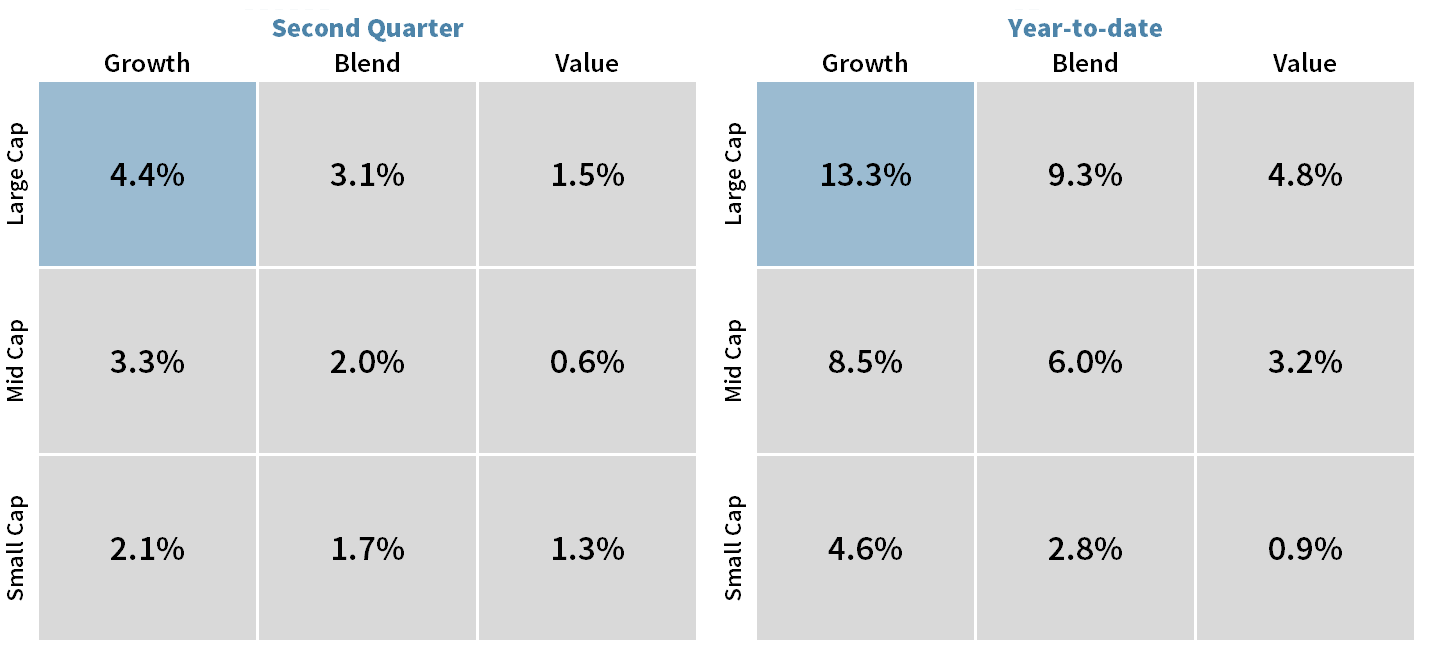
The continued robust performance of U.S. equities was led by large-cap growth stocks. The Health Care sector was a big contributor in 2017, even as health care reform struggles in Washington. Financials and Industrials made notable gains, while Technology added modestly in Q2 to its stellar performance in Q1. Stocks like Apple, Alphabet, Amazon and Facebook pushed forward despite their lofty valuations.
CHART 2: U.S. Size and Style Leadership
Large Cap Growth is the undisputed leader thus far in 2017, thanks in part to Technology and Health Care.
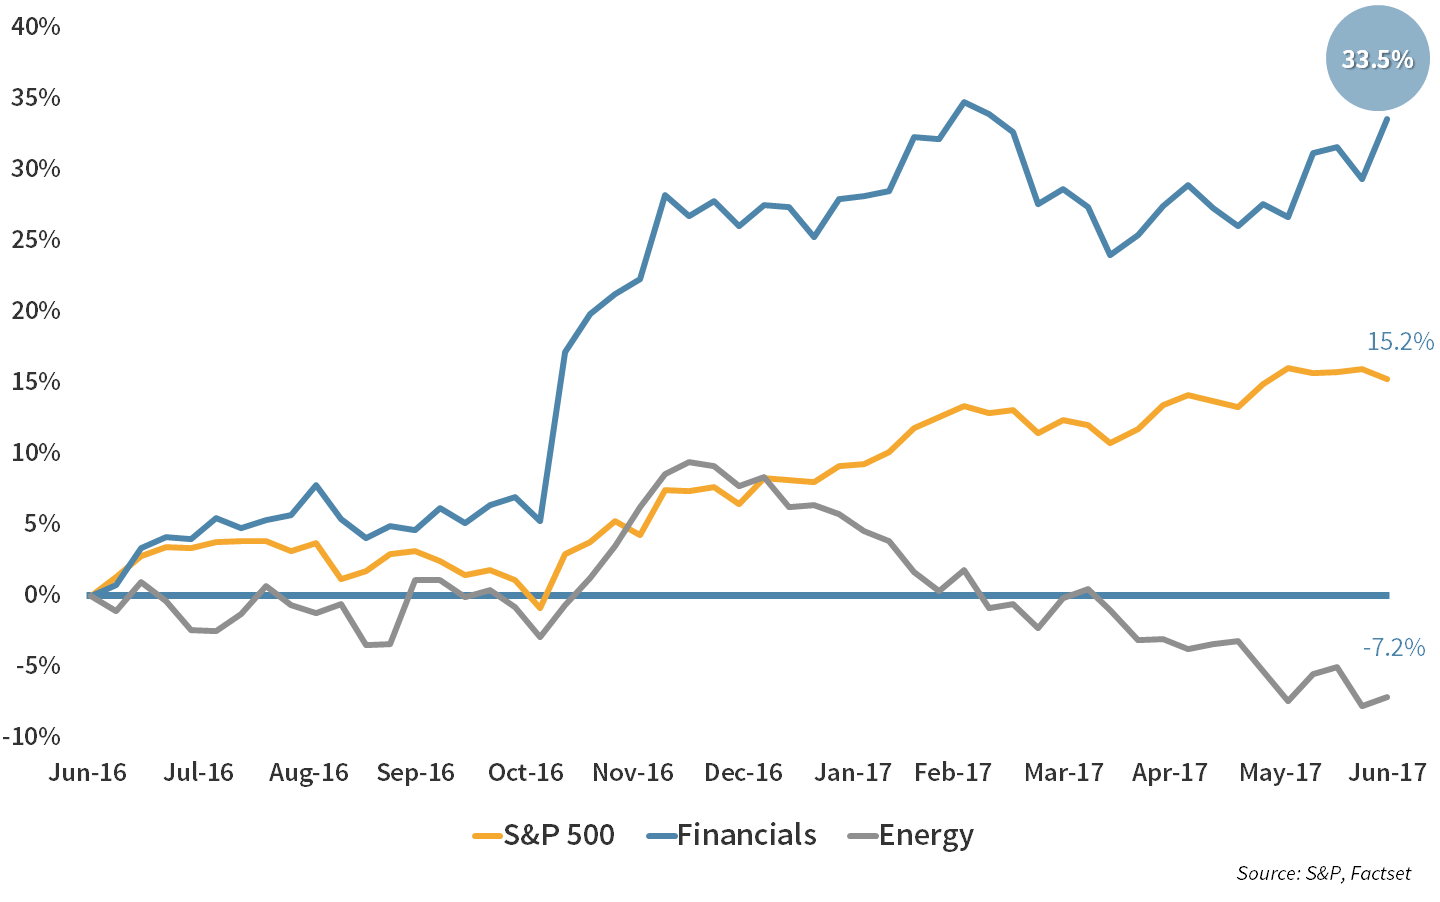
Tech performance has dominated the headlines this year, but looking over the past 12 months, it is the Financials that have advanced the most. Hopes are still riding high that the sector will benefit from deregulation and higher interest rates (and preferably a steepening yield curve – see more on this below). Energy has been the laggard as oil prices have been rangebound at a relatively low level. Despite attempts by OPEC to cut, the market remains oversupplied, with the U.S. shale producers more than willing to step in and fill any OPEC supply void.
CHART 3: Best and Worst Sectors
Financials remain the best performing sector of the past 12 months on hopes for tax reform, deregulation, and higher rates. Energy has struggled in the face of an oil supply glut.
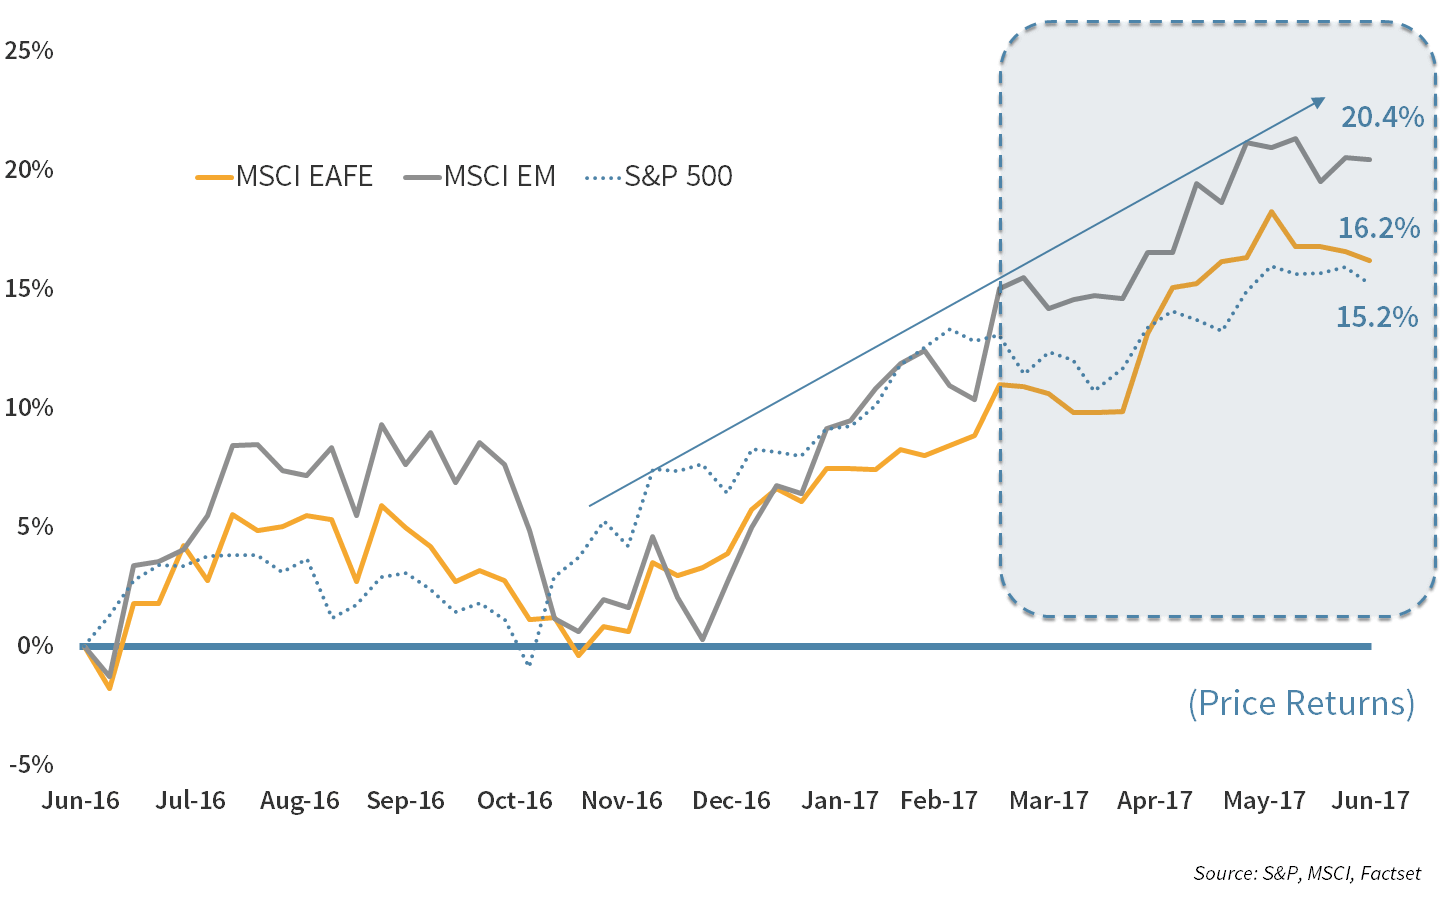
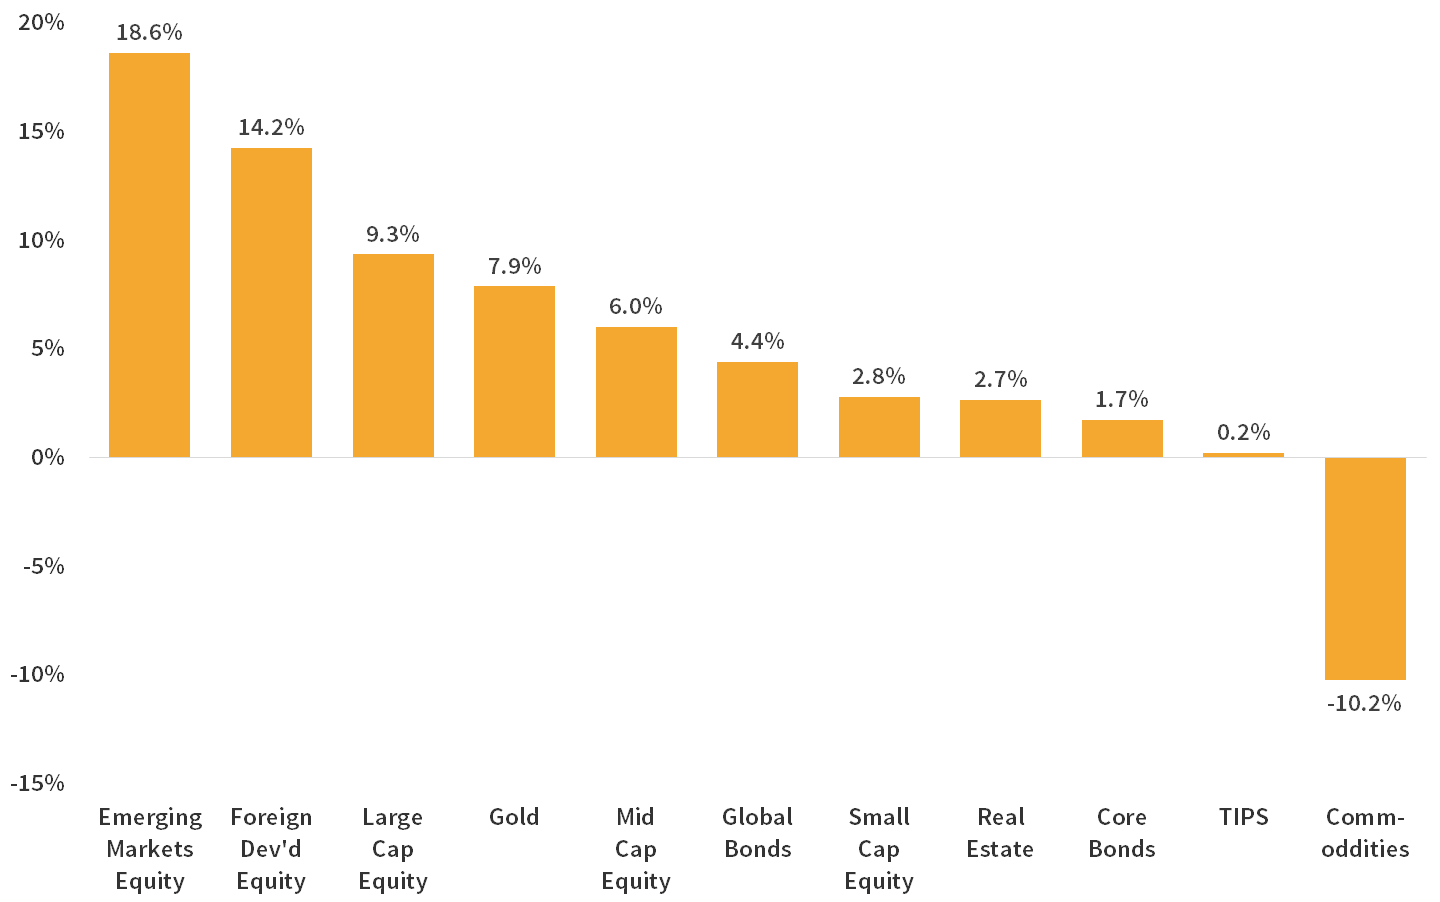
Diversified asset allocation benefited this year from the inclusion of foreign stocks. Both Developed Markets and Emerging Markets have outperformed U.S. equities year-to-date. With the U.S. market being so strong over the past seven years, you would be forgiven for forgetting the importance of diversification. A well-diversified portfolio reduces overall risk and provides natural opportunities to rebalance out of expensive assets into those offering better value.
CHART 4: Global Performance
Emerging Markets have outperformed over the past 12 months led by China. Developed Markets have done well courtesy of a weakening USD and improving fundamentals in Europe.
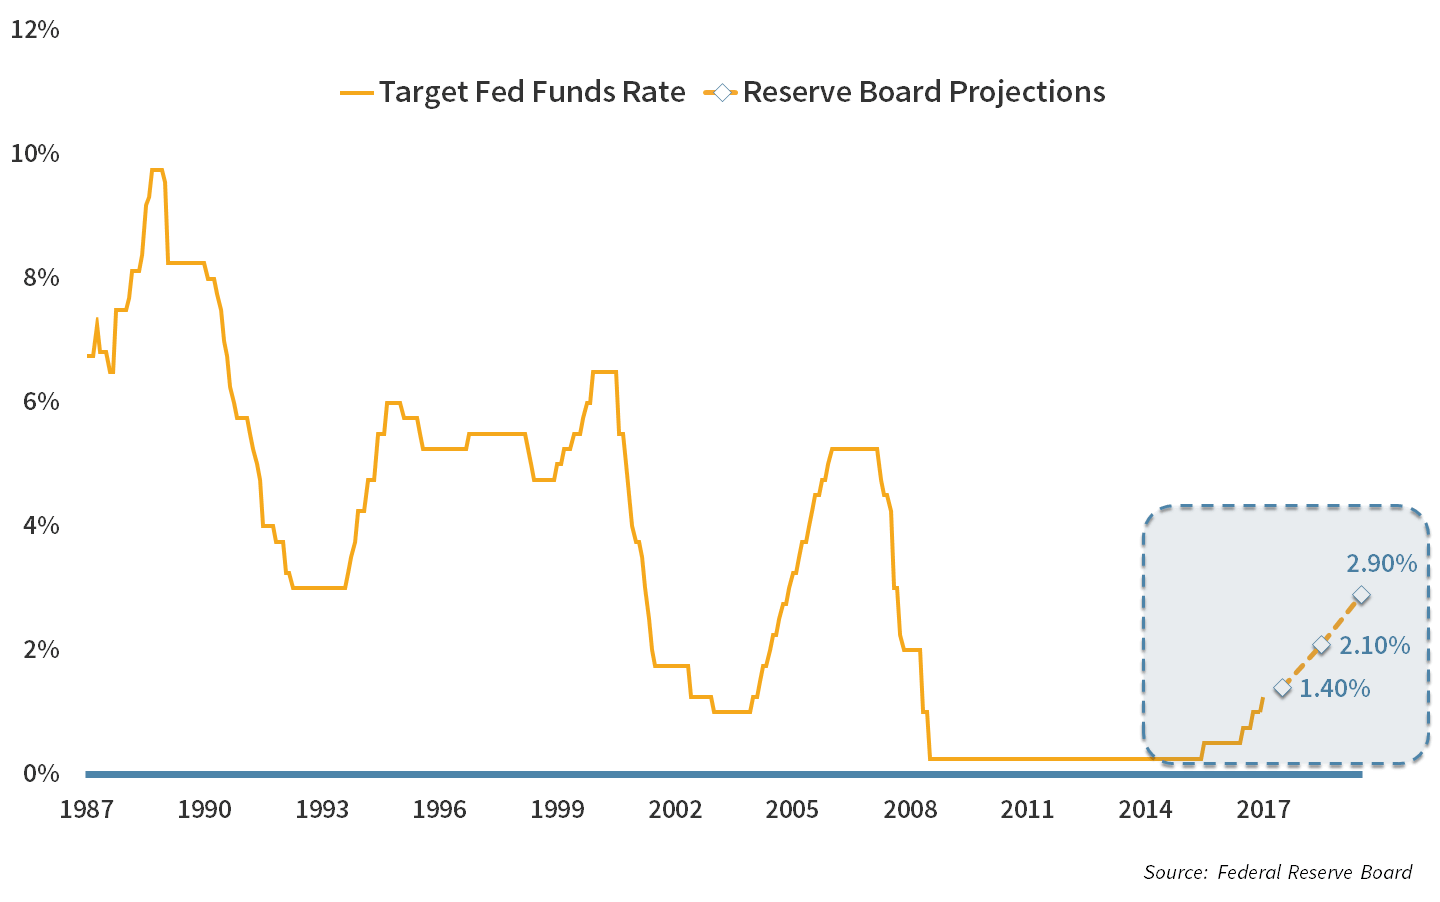
The Federal Reserve’s return to a policy of raising rates has been an ongoing story of the past year and a half. The Fed has raised rates twice this year (25bps each time). Additional increases are anticipated, with the Fed targeting 2.9% by the end of 2019. However, analysts currently see less than a 50% chance of another increase this year.
CHART 5: The Fed Funds Rate
The Fed raised rates in June, the second increase of 2017. They anticipate additional increases, with a 2.9% target by 2019. But this will be dependent on trends in employment, wages, and inflation.
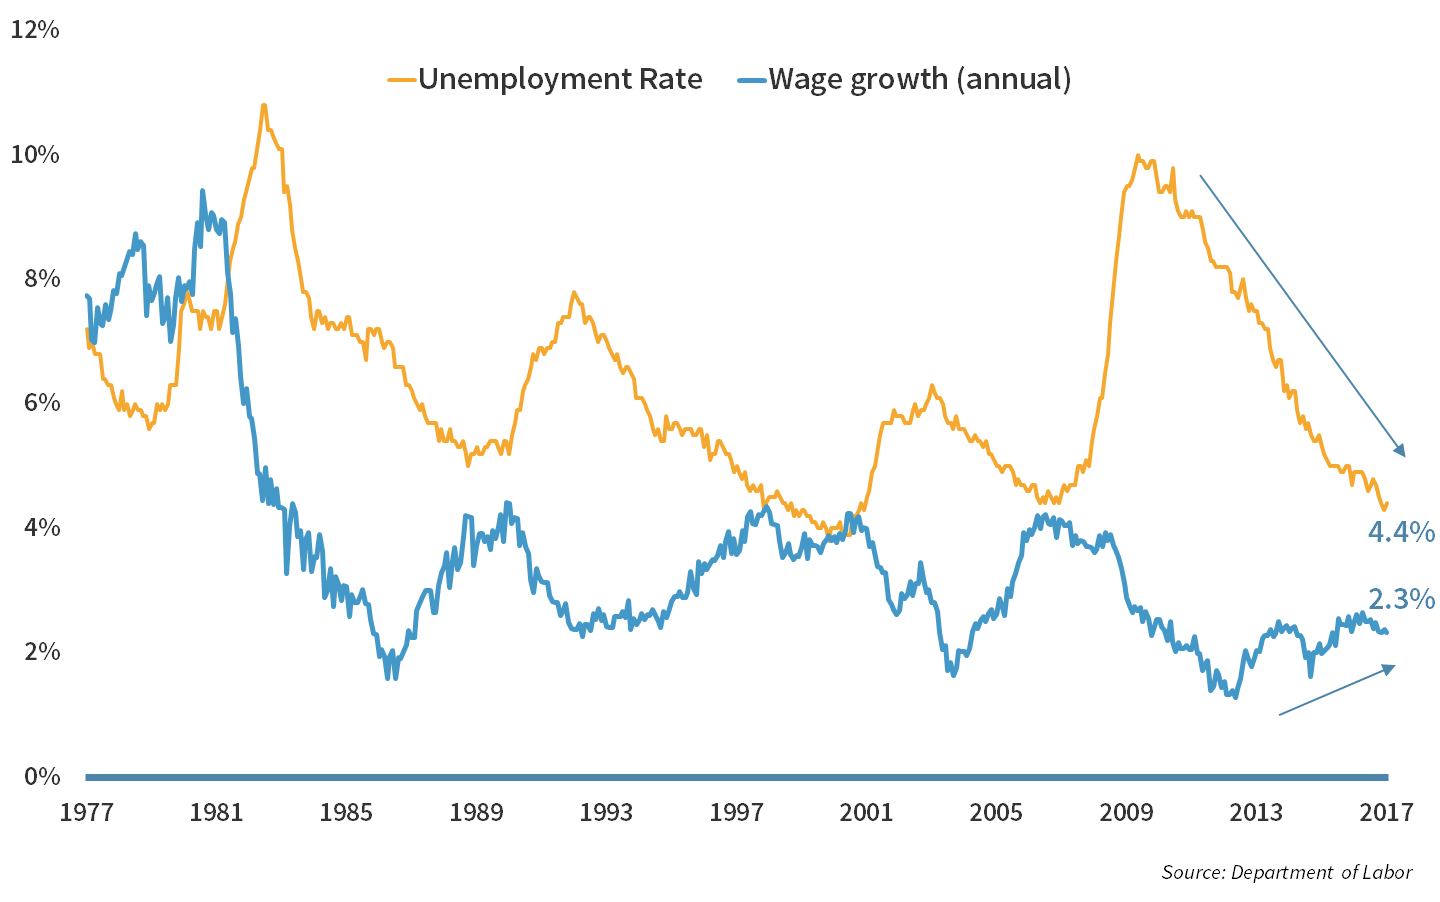
The pace of the rate increases will be somewhat data dependent, with the Fed focused on trends in employment, wages and inflation. As shown below, unemployment has been steadily dropping and now stands at a fairly low level of 4.4%. Wage growth has been less cooperative. While wages have increased, the gains have been modest. In addition, the gains have not been equivalent across the income spectrum, with most of the gains coming to those with higher income. Automation and globalization provide challenges to low-income earners.
Chart 6: Unemployment and Wages
The Fed will be pleased with the continued progress in unemployment, while wages have proven more stubborn.
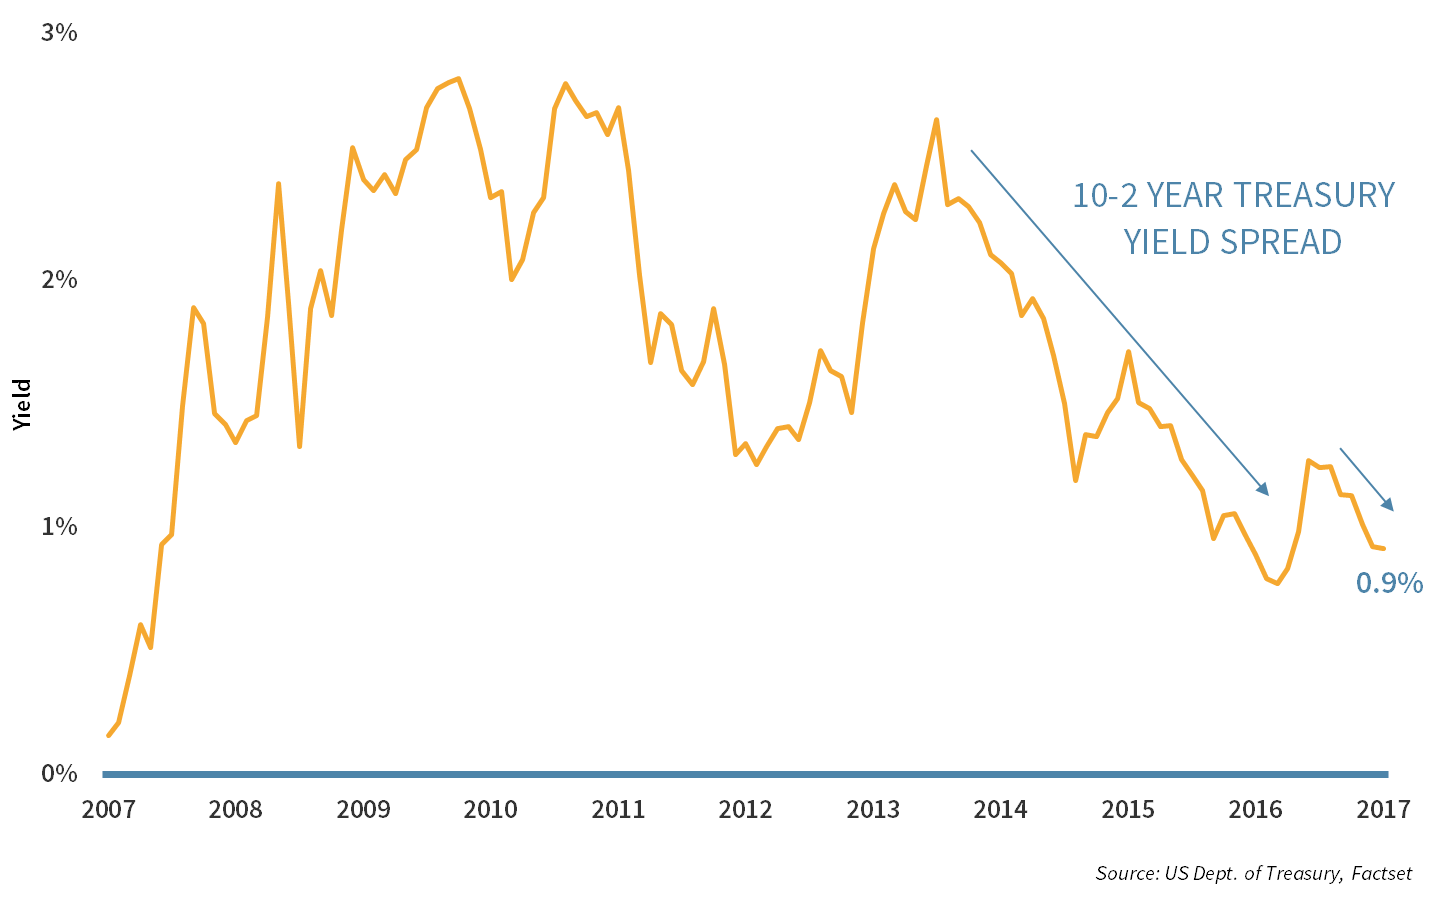
Despite the rising Fed Funds rate, the yield curve has been flattening, as can be seen in the spread between the yields of 2-year and 10-year U.S. Treasuries shown below. The Fed’s rate increases have helped to push up 2-year yields, but 10-year yields have been more stubborn. A healthy spread between long and short yields incentivizes banks to lend, which can help spur further economic growth. A flattening yield curve is often seen as a bearish signal. With long yields historically low globally, there is a significant overhang on U.S. yields, which seems unlikely to abate anytime soon.
CHART 7: TREASURY SPREAD
Rising Fed rates have thus far only resulted in a flattening of the yield curve. Banks need to see a healthy spread to be incentivized to lend, which can spur further economic growth.
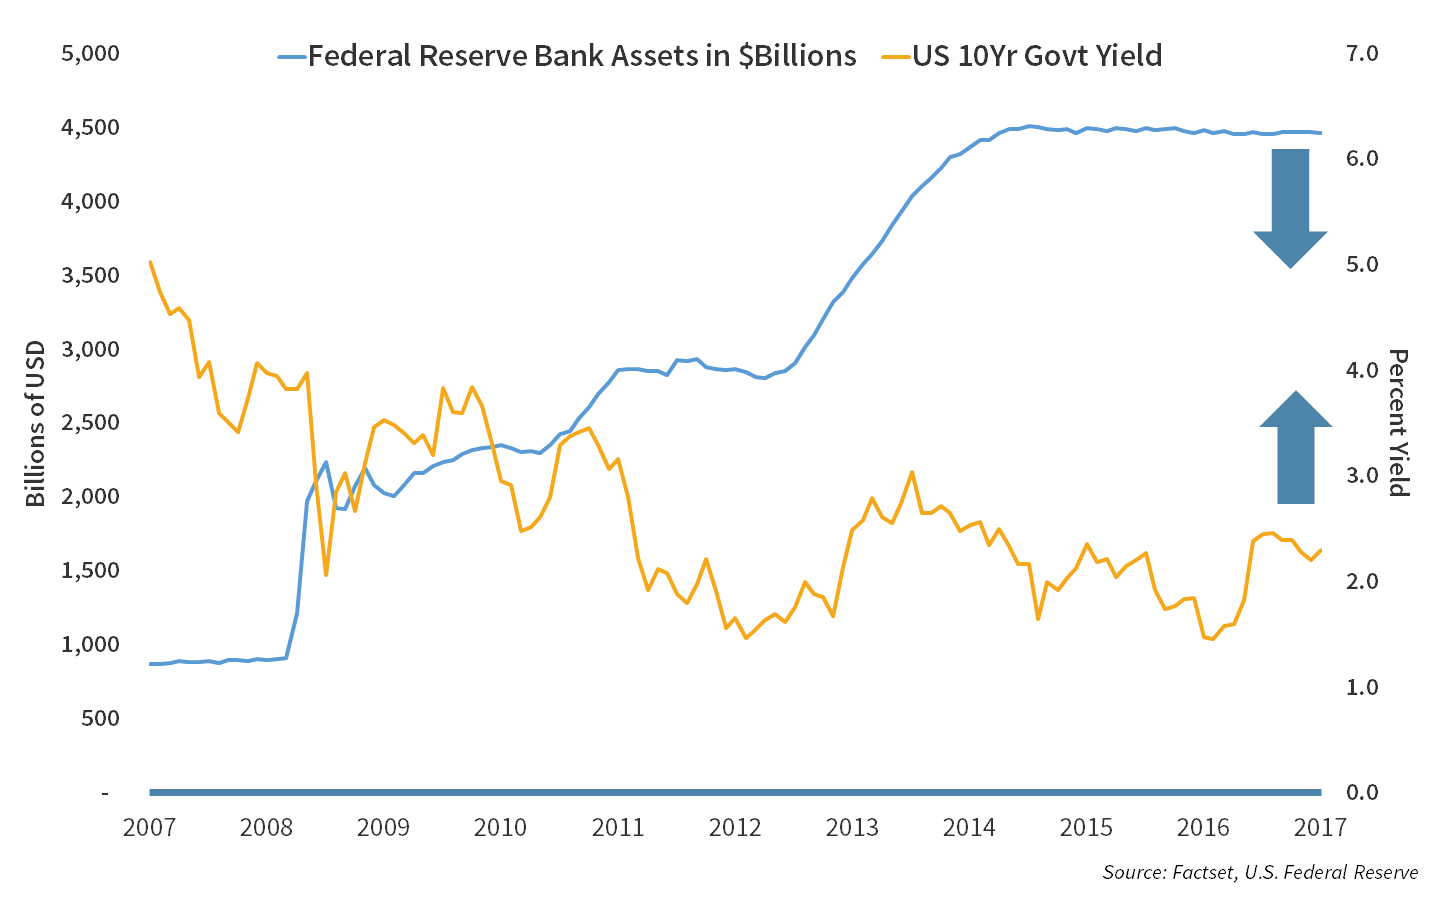
One option the Fed has to combat the flat yield curve is to use its balance sheet. The Fed’s balance sheet has ballooned to $4.5 Trillion as it has purchased bonds and mortgage-backed securities in the wake of the financial crisis (known as “quantitative easing”). This has helped to suppress yields. As the chart below shows, the balance sheet has been held fairly steady for the past few years. Should the Fed decide to reduce, or “taper”, their purchases, the reduction in demand could help raise yields at the longer end of the curve. The last time the Fed considered tapering, stocks sold off. With the economy on more solid footing, the market may be more receptive this time around.
Chart 8: The Fed Balance Sheet
To counter the flat yield curve, the Fed may have to start using its balance sheet to support yields at the long end of the curve.
The H2 2017 Playbook
In many ways, we are in uncharted territory. Interest rates are low globally. Equity valuations continue to push further above average. Technology disruption across industries is increasingly present. Yet, economic fundamentals are good and improving.
The two most dangerous actions investors can take in this environment are to 1) sit on the sidelines, or 2) chase risky “opportunities”. While equity valuations appear above average, improving fundamentals and corporate-friendly legislation could push them significantly higher. Bond yields are low, yet still provide protection with some modest yield.
Our approach:
- Stick to our process for identifying Quality and Value within a diversified portfolio. We continuously seek out opportunities to exit more expensive asset classes and securities and rotate into those offering the best combination of Quality and Value.
- Keep our bond portfolio duration low until the longer maturity bonds offer better value. If yields begin to rise, a short duration portfolio enables us to rotate into higher yielding instruments as bonds mature.
Market Indices
As of June 30, 2017
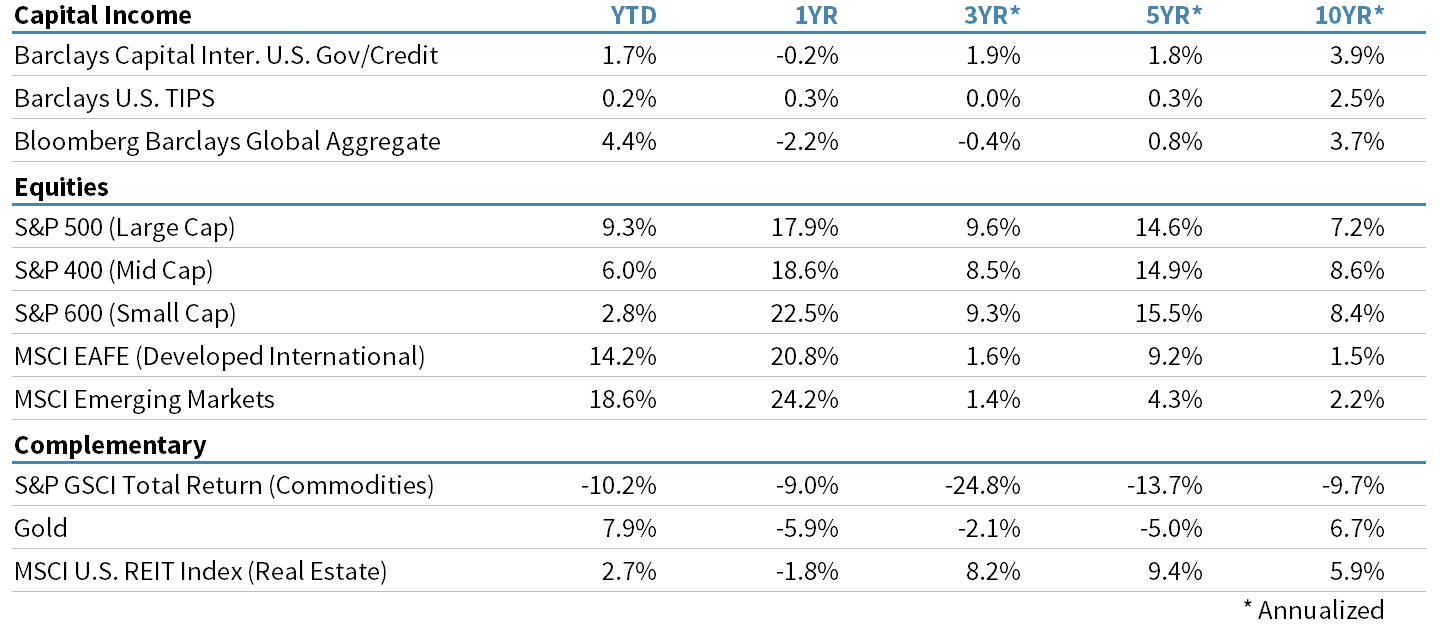
Performance By Asset Class
As of June 30, 2017
About Strategic
Founded in 1979, Strategic is a leading investment and wealth management firm managing and advising on client assets of over $2 billion.
OverviewDisclosures
Strategic Financial Services, Inc. is a SEC-registered investment advisor. The term “registered” does not imply a certain level of skill or training. “Registered” means the company has filed the necessary documentation to maintain registration as an investment advisor with the Securities and Exchange Commission.
The information contained on this site is for informational purposes and should not be considered investment advice or a recommendation of any particular security, strategy or investment product. Every client situation is different. Strategic manages customized portfolios that seek to properly reflect the particular risk and return objectives of each individual client. The discussion of any investments is for illustrative purposes only and there is no assurance that the adviser will make any investments with the same or similar characteristics as any investments presented. The investments identified and described do not represent all of the investments purchased or sold for client accounts. Any representative investments discussed were selected based on a number of factors including recent company news or earnings release. The reader should not assume that an investment identified was or will be profitable. All investments contain risk and may lose value. There is no assurance that any investments identified will remain in client accounts at the time you receive this document.
Some of the material presented is based upon forward-looking statements, information and opinions, including descriptions of anticipated market changes and expectations of future activity. Strategic Financial Services believes that such statements, information, and opinions are based upon reasonable estimates and assumptions. However, forward-looking statements, information and opinions are inherently uncertain and actual events or results may differ materially from those reflected in the forward-looking statements. Therefore, undue reliance should not be placed on such forward-looking statements, information and opinions.
No content on this website is intended to provide tax or legal advice. You are advised to seek advice on these matters from separately retained professionals.
All index returns, unless otherwise noted, are presented as price returns and have been obtained from Bloomberg. Indices are unmanaged and cannot be purchased directly by investors.