The Eve of Change
 Doug Walters
In this edition of our quarterly Perspectives, we review the third quarter and lay out the game plan on the eve of potential big changes at the Fed.
Dissecting Q3 2017
Market optimism continued to run high in the third quarter, pushing the S&P 500 up over 14% on the year. This performance was achieved despite a challenging quarter on other fronts, most notably the escalation of tensions with North Korea and a series of devastating hurricanes.
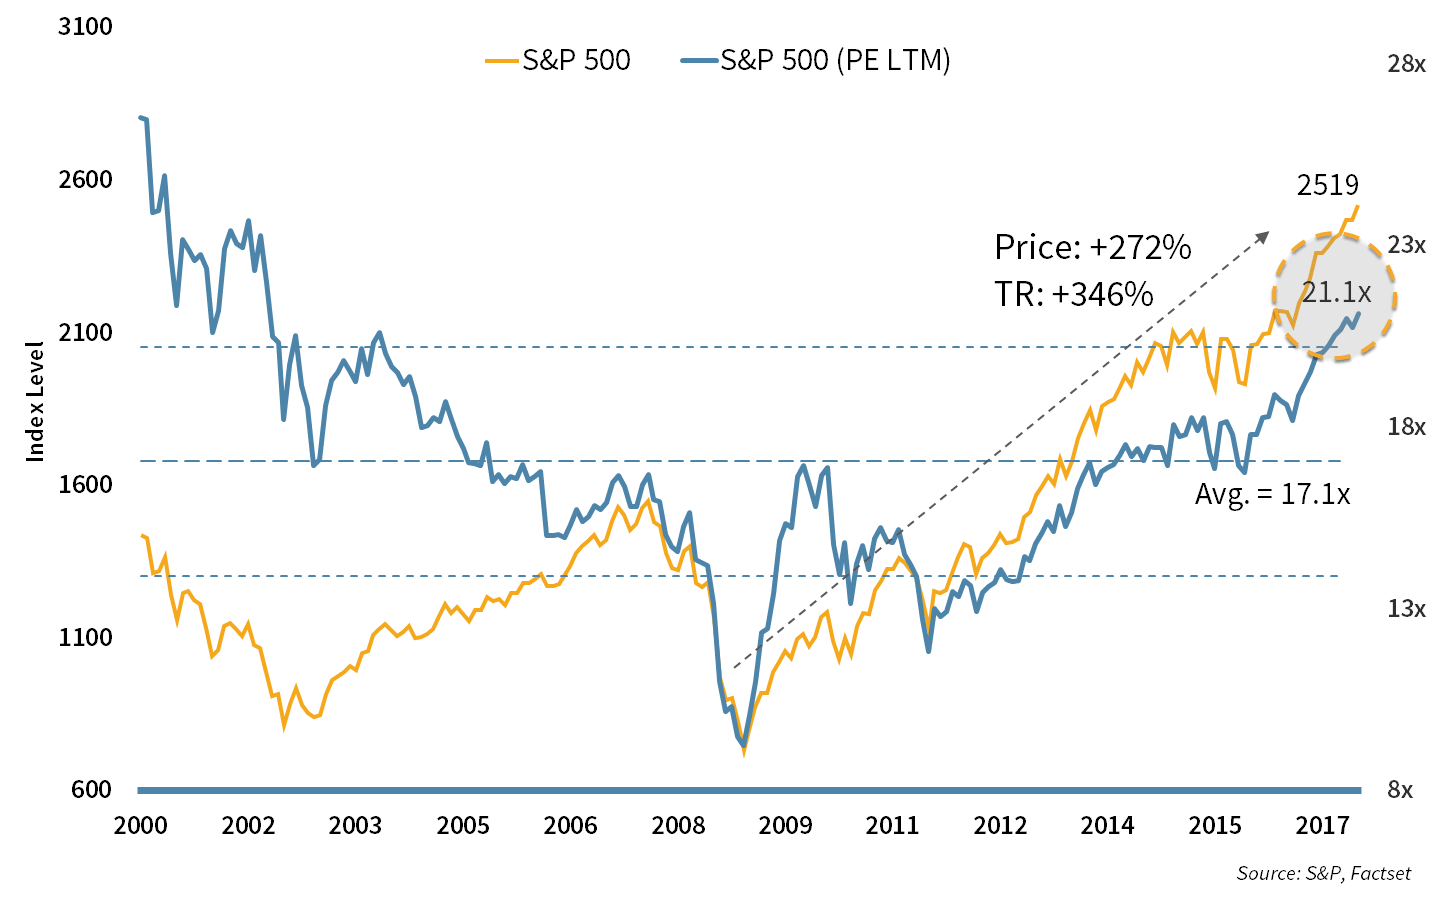
As the chart below shows, the continued advance of equities has pushed valuations above their historical average. We are often asked if it is time to “get out of the market.” We do not ascribe to market timing, so generally, the answer is “no.” Rather, we continuously look for the best Quality and Value in the market so that if there is a pullback or correction, there is no permanent loss of capital. In addition, we look for opportunities to slant our asset allocation to those segments with the best long-term fundamentals.
Chart 1: Equity Valuation
Equities advanced faster than earnings, pushing valuations higher. An accommodative administration and low fixed income yields provide continued support.
2017 has been the year of the large-cap growth stocks. The so-called FAANG stocks, Facebook, Apple, Amazon, Netflix and Google (Alphabet) have all been standout performers, with returns of 25-50%. Our dual mandate of Quality and Value has been a barrier to allowing some of these stocks into our portfolios in the recent past. While they are all generally good quality, valuations for some are questionable. We are very comfortable staying on the sideline of stocks that are running up, if their valuation cannot be fundamentally justified.
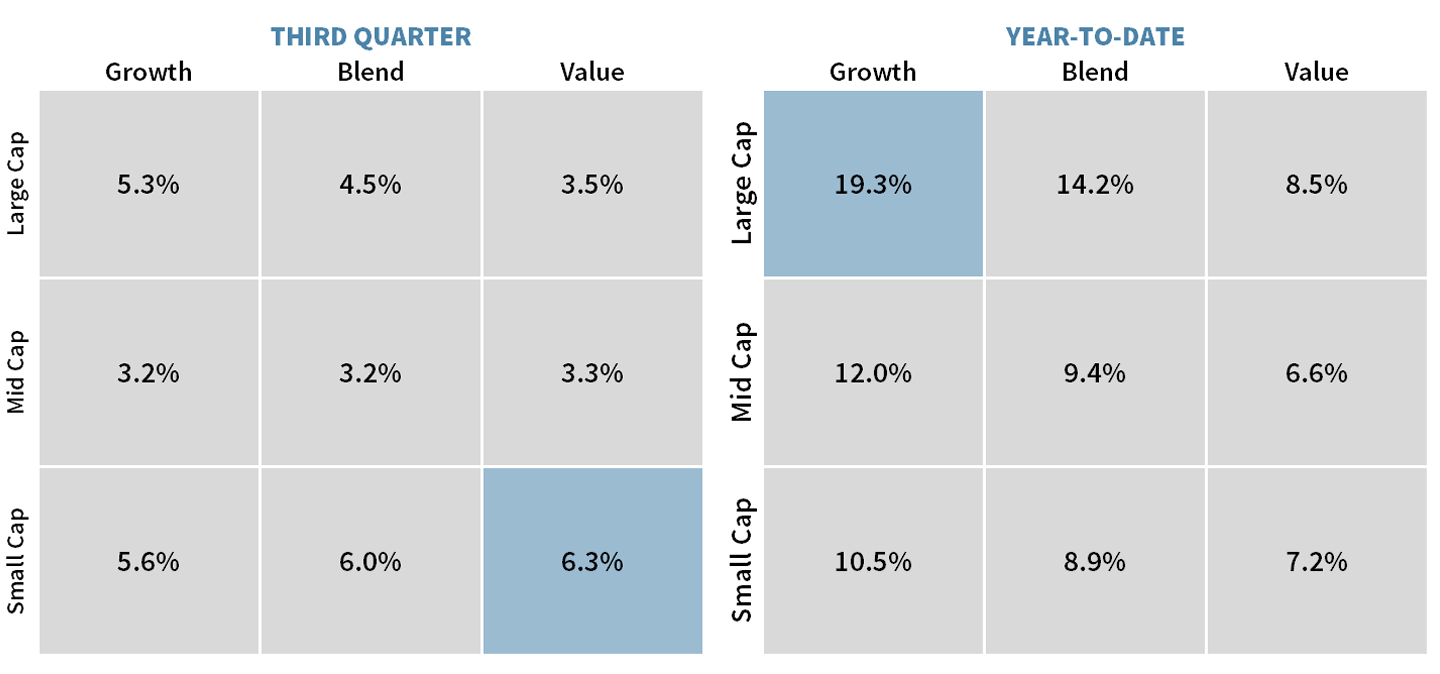
With that said, we witnessed a rotation in the market in Q3. Large Cap Growth did well, but Small Cap Value was the best performing segment of U.S. equities (see the chart below). We see good reason for small-cap stocks to outperform, as they are potentially benefiting the most from tax reform, deregulation and the potential for acquisition.
Chart 2: U.S. Size and Style Leadership
Large Cap Growth has led equities this year, but we have started to see a rotation into Small Cap Value.
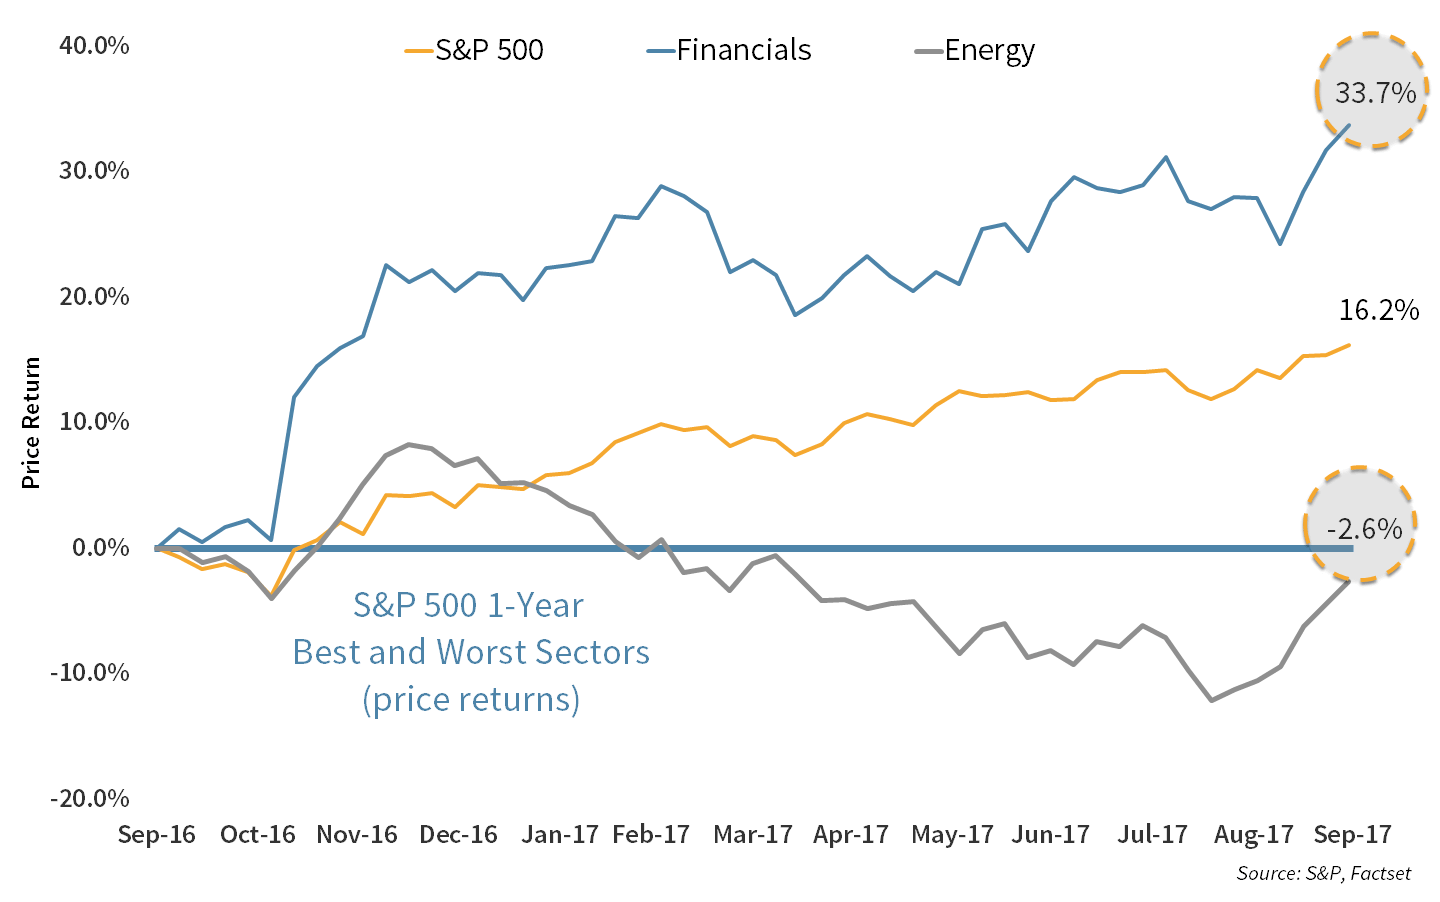
Tech stocks were the best performers in the third quarter followed by Energy which benefitted from rising commodity prices. However, as the chart below shows, over the past year, it is Financials that hold the top spot, while Energy (despite the recent rally), is still the worst performer. Financials are uniquely positioned to benefit from the deregulation that is being pushed by the current administration. There is also an expectation for interest rates to rise, which would be a benefit to many financial institutions. More on that later.
Chart 3: Best and Worst Sectors
Financials remain the best performing sector of the past 12 months on hopes for tax reform, deregulation, and higher rates. Energy has struggled but has rebounded some in the aftermath of a tough hurricane season.
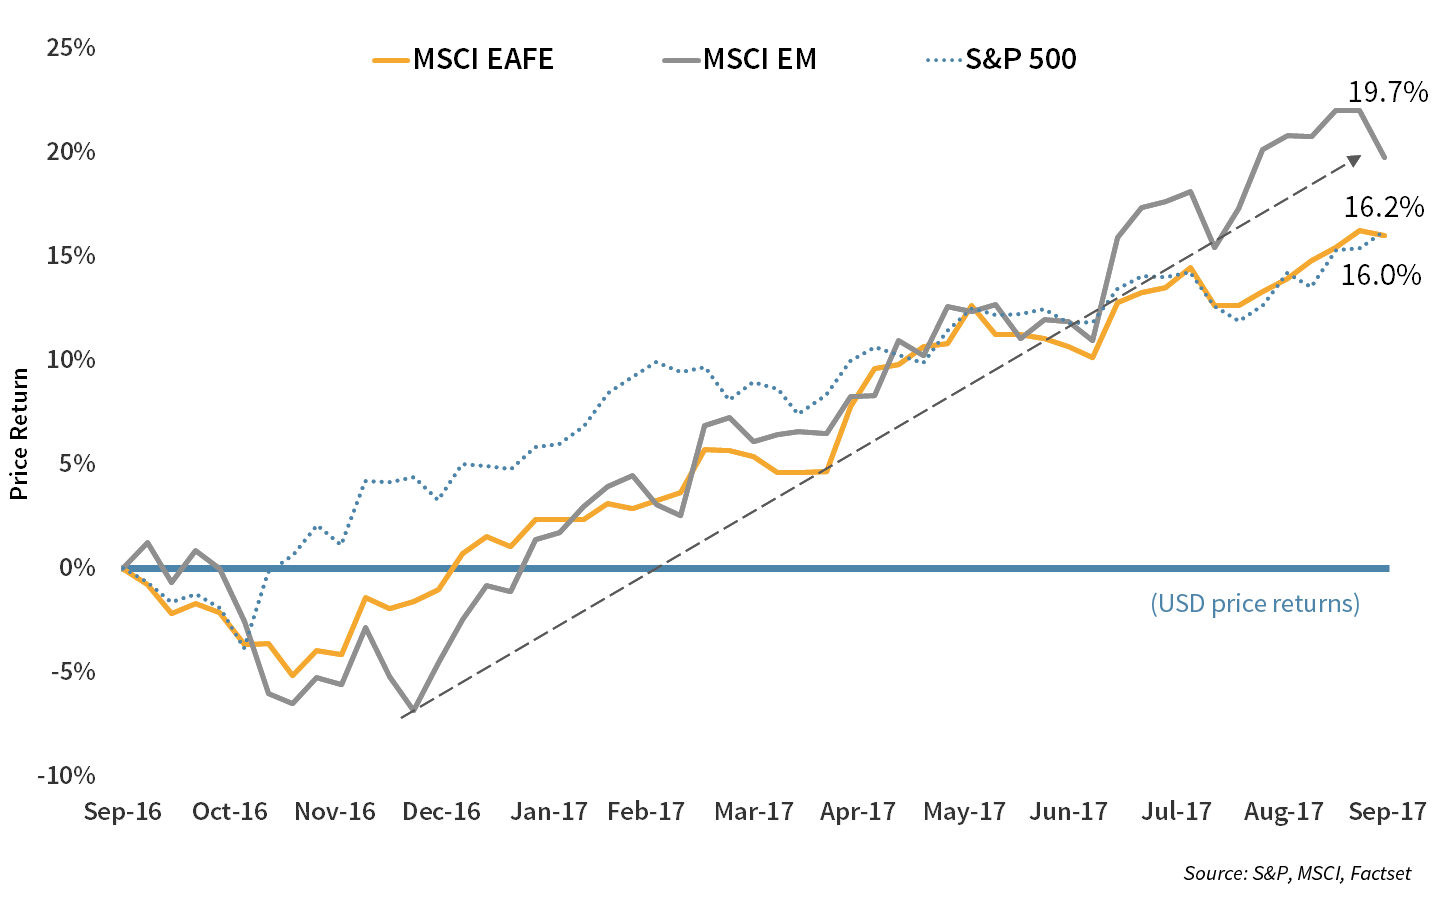
U.S. stocks did well, but so did their international counterparts. While the S&P 500 was up around 14%, Developed International and Emerging Markets were up 12% and 24% respectively (in local currency). U.S. investors also had the benefit of a weak dollar, which made the international performance look even better, with the two international markets returning 21% and 28% in U.S. dollars respectively.
It is always useful at times like this to take a step back and remind investors how important it is to hold a diversified portfolio which encompasses both domestic and international securities. The U.S. market has had a very good run, but there are times when it will underperform. Holding a diversified portfolio helps to smooth out the volatility in your portfolio value and provides the opportunity to regularly lock in gains from outperforming assets and redistribute them to areas of your portfolio offering better value.
Chart 4: Global Performance
Emerging Markets have outperformed over the past 12 months and by even more year-to-date, led by China. Developed Markets have benefited from a weakening USD.
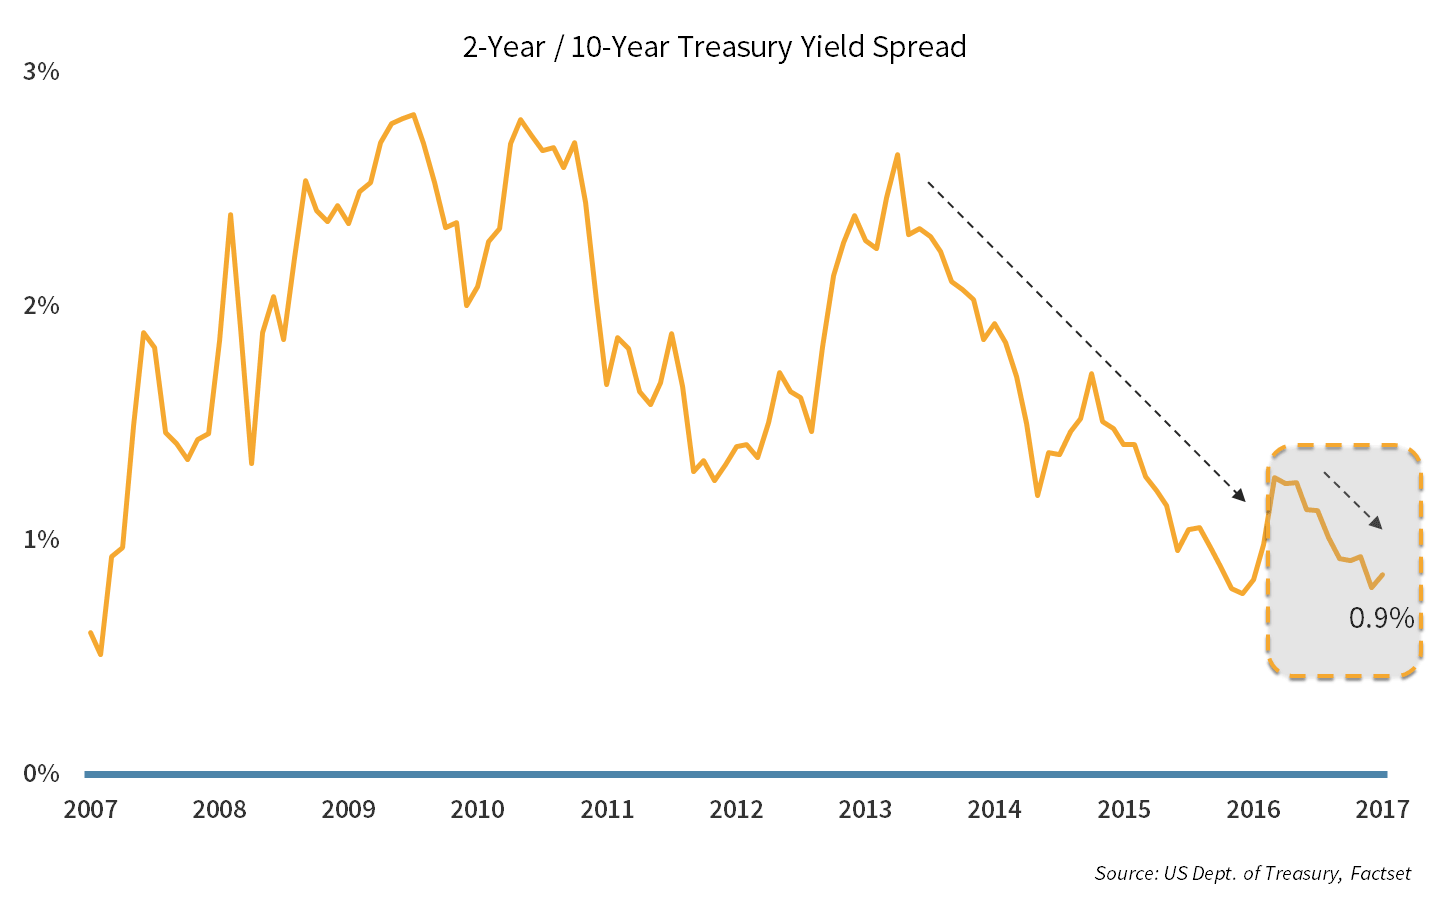
In the realm of fixed income, we have seen some upward pressure on the yields of short-term bonds. However, the challenge has been yields of longer-dated bonds. As the chart below shows, the difference between the interest on 10-year Treasuries and 2-year Treasuries has narrowed. While 2-year rates have risen this year, 10-year rates have fallen.
Why does this matter? This dynamic is somewhat problematic for banks who make their money borrowing short-term and lending long-term. If the spread between the short and long-term is too tight, they do not have an incentive to lend, which impedes economic growth.
Chart 5: Treasury Spread
The flat yield curve does not incentivize banks to lend, which can spur further economic growth. The Fed is contemplating using its balance sheet to try and support longer-dated yields.
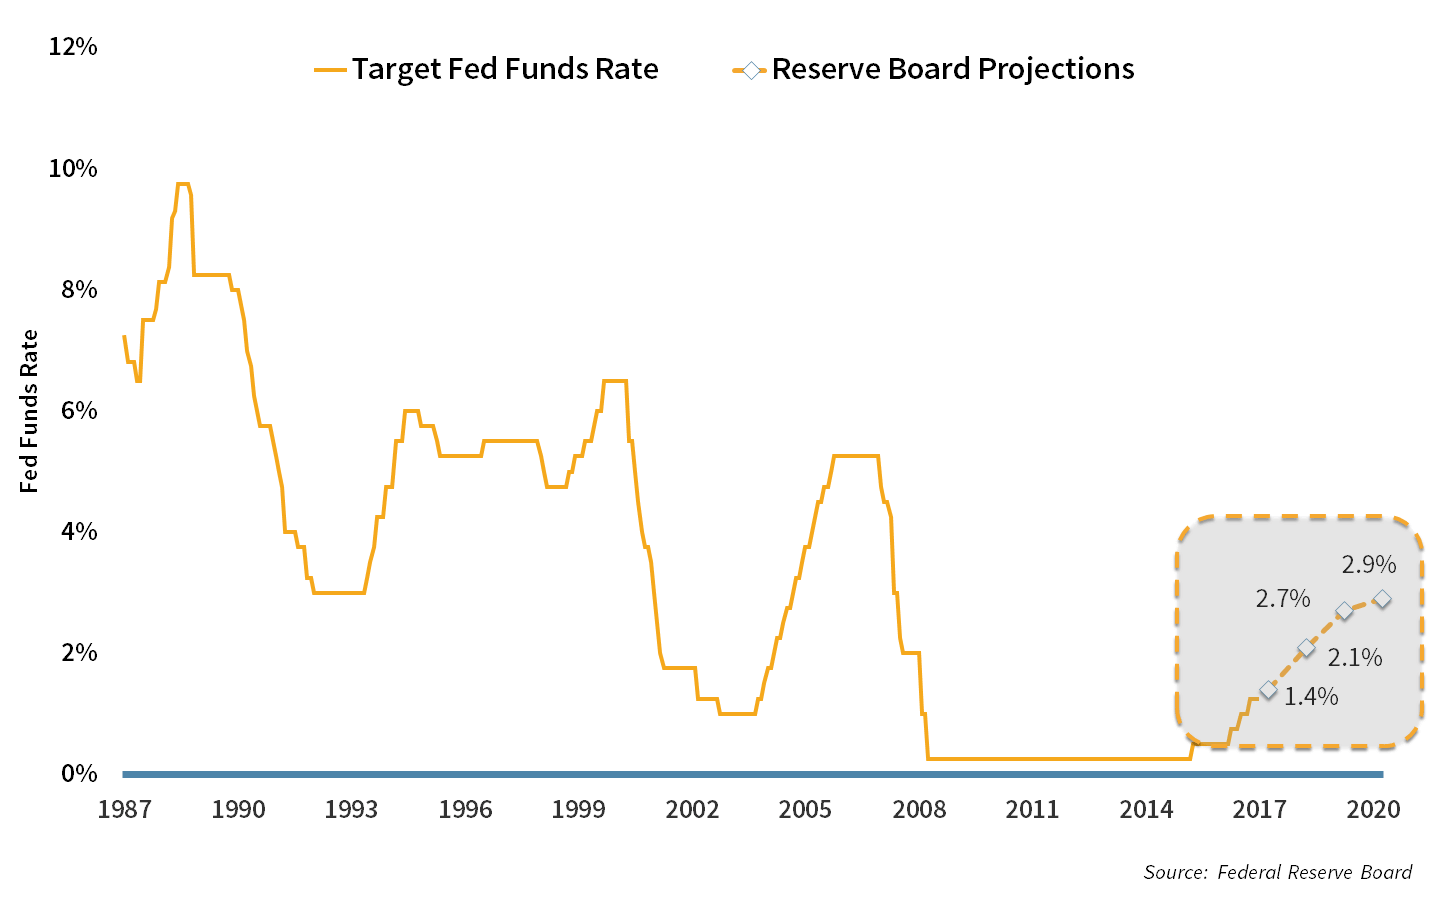
Short-term rates are heavily influenced by the Federal Reserve which has been attempting to raise rates from historically low levels over the past few years. As the chart below shows, the pace of increase is expected to be slow and measured. The Fed is trying to walk the tightrope of dialing back monetary stimulus, while not putting the brakes on the current pace of economic growth. To tackle long-term rates, they are now also talking about unwinding some of their asset purchases (quantitative easing), which helped keep rates low in the wake of the financial crisis.
Chart 6: The Fed Funds Rate
The Fed is expected to make a third 2017 rate raise in December, but future rate expectations have been coming down. With the majority of the Board of Governors, as well as the Chairwoman, to be replaced in the next few months, policy uncertainty is high.
Their ability to raise rates is largely dependent on the strength of their key indicators: growth, unemployment, and inflation. GDP growth is modest but consistently positive. Unemployment is low and creeping lower (see chart below). Inflation has been the challenge.
Chart 7: Employment and Wages
The Fed is pleased with the low unemployment but would like to see more wage growth.
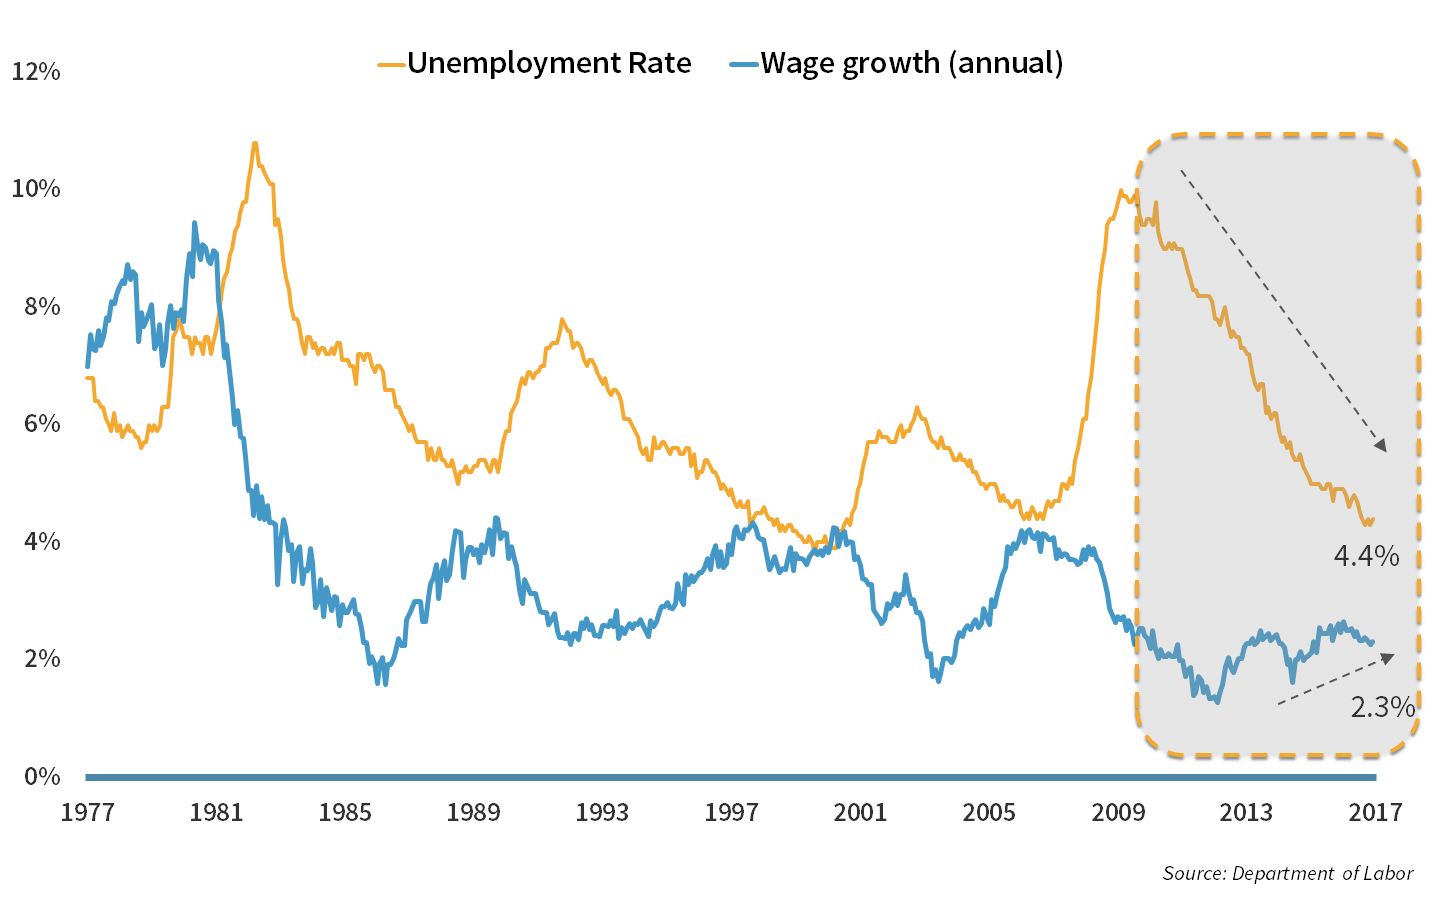
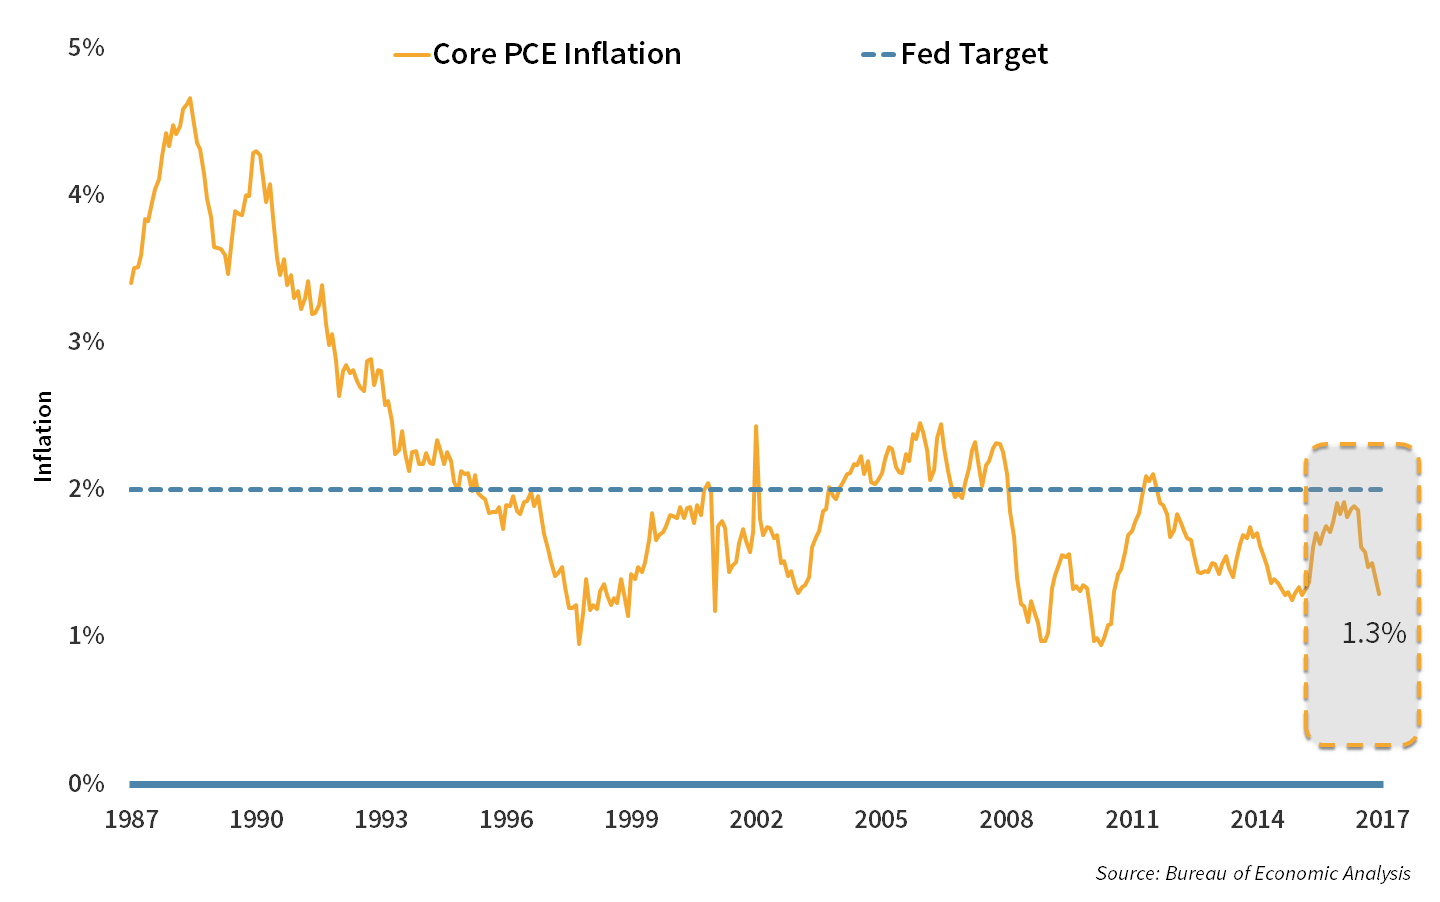
The Fed targets a 2% inflation rate. As can be seen in the chart below, maintaining that rate has been a challenge. With the economy growing and unemployment low, the natural assumption would be that wages would rise and inflation would start to pick up. However, as of yet, wage growth has been elusive. With the administration looking to accelerate growth and cut taxes, perhaps wages will finally yield to economic pressures.
Chart 8: Inflation
Inflation is below the Fed’s target and is a source of concern. However, if the administration has success with its pro-growth agenda and installs accommodative Fed Governors, the challenge may be keeping inflation from getting too high.
The Q4 2017 Playbook
The next few months will be particularly interesting for “Fed watchers.” The Federal Reserve and its decisions on monetary policy have a significant influence on asset valuations. However, currently four of the seven Board of Governor seats are vacant at the Fed, and Chairwoman Yellen’s term ends in February. All of these positions will be filled by the Trump administration, giving the President an unprecedented ability to mold the Fed into his vision.
There are drastically different opinions about what that vision may be, ranging from a dovish Fed that would help further boost stocks and the economy (and help the President meet his aggressive growth ambitions), to a hawkish Fed that would seek to raise rates quickly.
Equities are undeniably trading at valuations that are above average, while fixed income yields, particularly longer duration, remain low. A robust and improving economy, combined with a very corporate-friendly administration provide much justification for optimism. But the margin of safety on valuations is slim, and we are on the eve of major changes at the Federal Reserve. In this environment, we believe investors are best served by a relentless focus on Quality and Value. We recommend:
- Avoiding the allure of expensive, high-growth, fast-moving, equities,
- Keeping fixed income exposure short-term and highly liquid, and
- Looking for opportunities in markets and assets that provide attractive diversification, such as Emerging Markets, U.S. Small Cap Equities, and Gold.
Market Indices
As of September 30, 2017
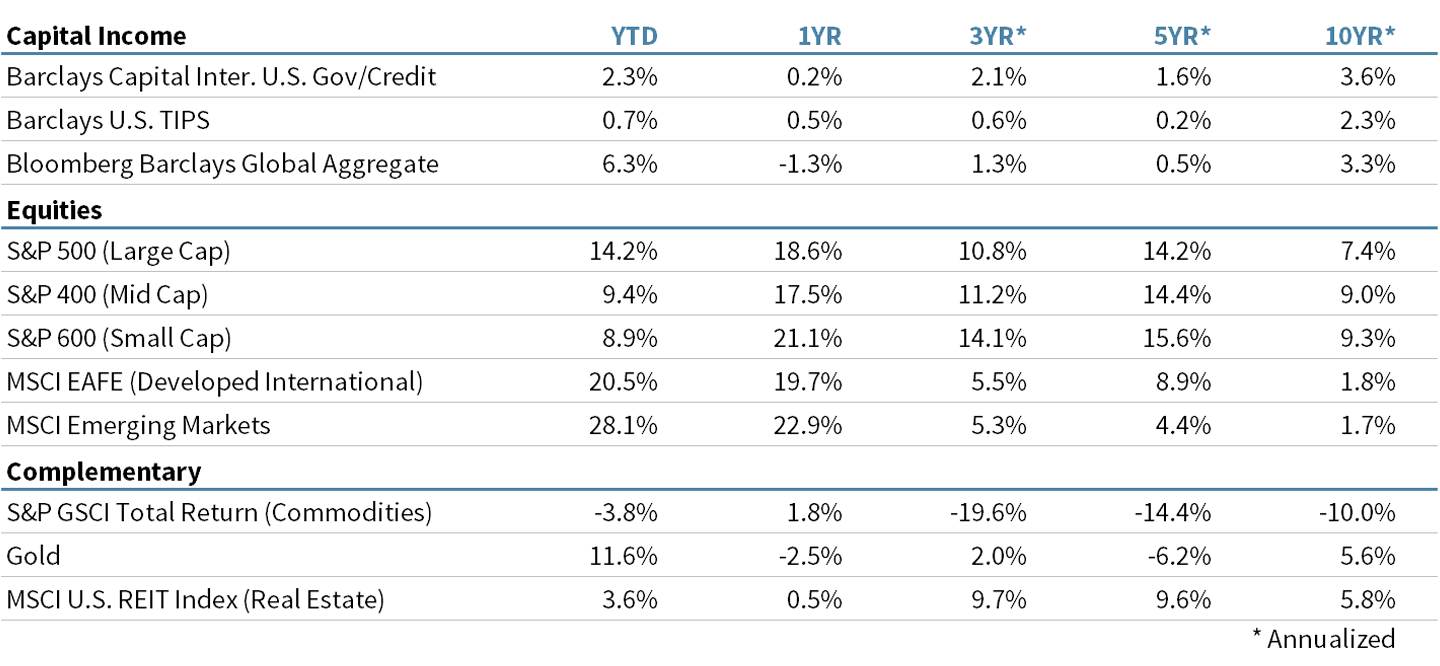
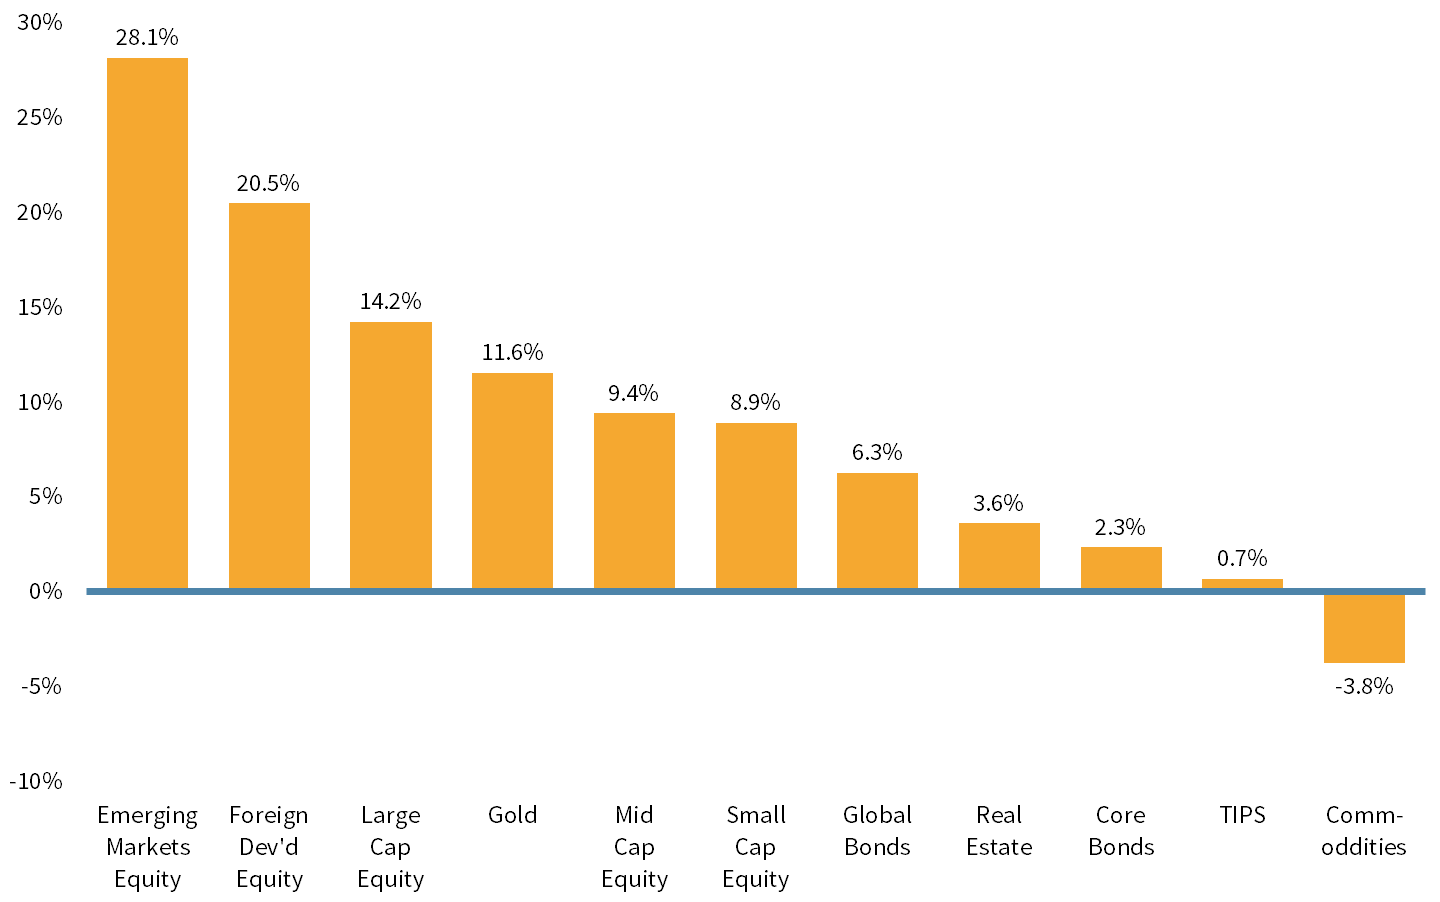
Performance By Asset Class
As of September 30, 2017
About Strategic
Founded in 1979, Strategic is a leading investment and wealth management firm managing and advising on client assets of over $2 billion.
OverviewDisclosures
Strategic Financial Services, Inc. is a SEC-registered investment advisor. The term “registered” does not imply a certain level of skill or training. “Registered” means the company has filed the necessary documentation to maintain registration as an investment advisor with the Securities and Exchange Commission.
The information contained on this site is for informational purposes and should not be considered investment advice or a recommendation of any particular security, strategy or investment product. Every client situation is different. Strategic manages customized portfolios that seek to properly reflect the particular risk and return objectives of each individual client. The discussion of any investments is for illustrative purposes only and there is no assurance that the adviser will make any investments with the same or similar characteristics as any investments presented. The investments identified and described do not represent all of the investments purchased or sold for client accounts. Any representative investments discussed were selected based on a number of factors including recent company news or earnings release. The reader should not assume that an investment identified was or will be profitable. All investments contain risk and may lose value. There is no assurance that any investments identified will remain in client accounts at the time you receive this document.
Some of the material presented is based upon forward-looking statements, information and opinions, including descriptions of anticipated market changes and expectations of future activity. Strategic Financial Services believes that such statements, information, and opinions are based upon reasonable estimates and assumptions. However, forward-looking statements, information and opinions are inherently uncertain and actual events or results may differ materially from those reflected in the forward-looking statements. Therefore, undue reliance should not be placed on such forward-looking statements, information and opinions.
No content on this website is intended to provide tax or legal advice. You are advised to seek advice on these matters from separately retained professionals.
All index returns, unless otherwise noted, are presented as price returns and have been obtained from Bloomberg. Indices are unmanaged and cannot be purchased directly by investors.