Be Prepared
 Doug Walters
In this edition of our quarterly Perspectives, we dissect the market drivers of the first quarter and provide our playbook for the rest of the year. Uncertainty is high, and we see an opportunity to prepare.
Dissecting Q1 2017
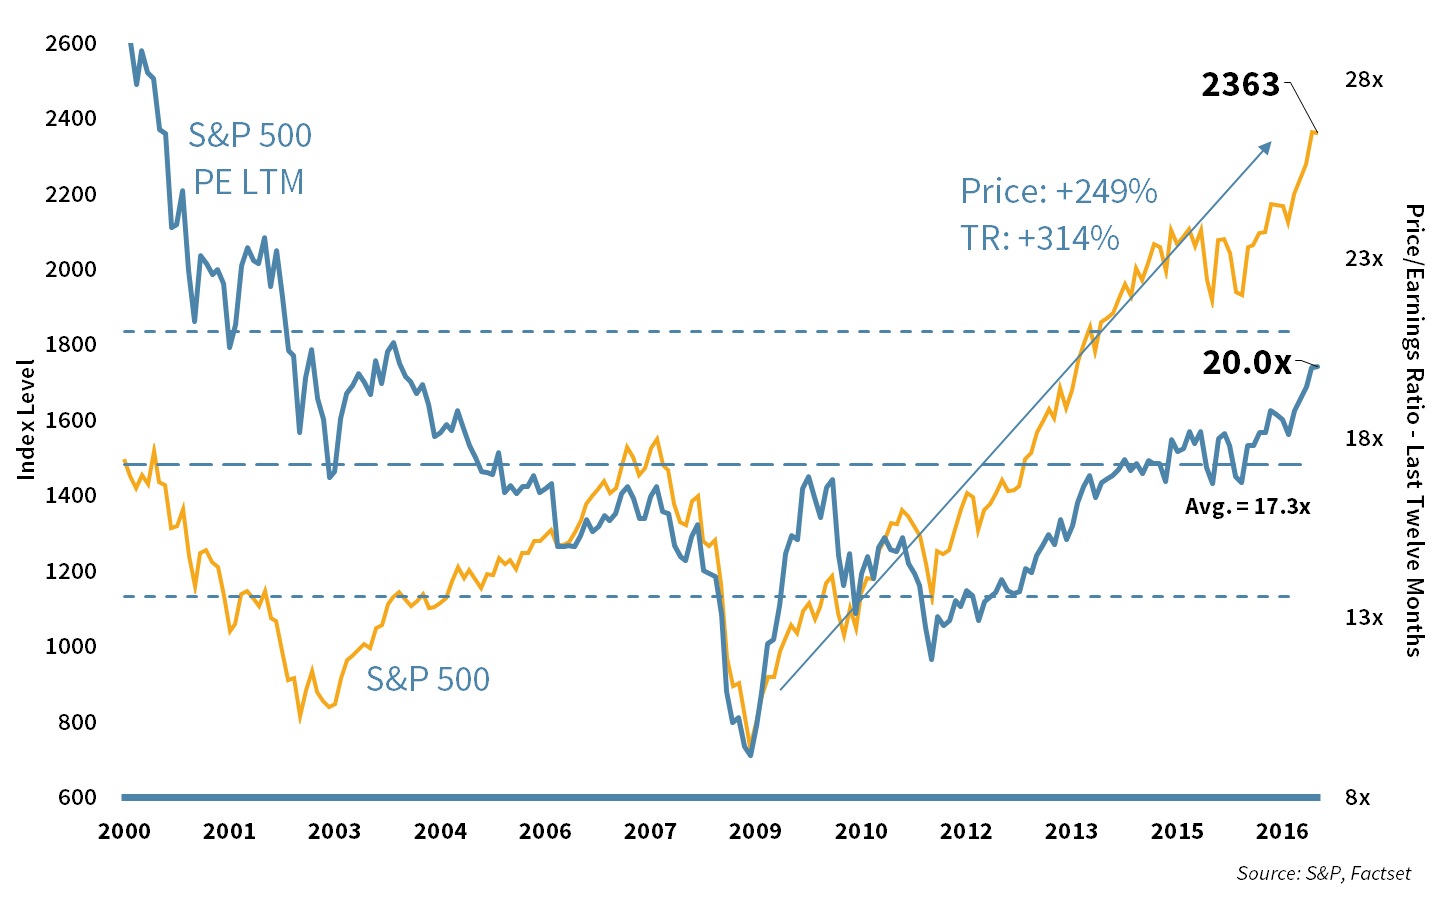
With so much focus on the post-election rally, one would be forgiven for forgetting that this equity rally had its eighth birthday this quarter. Since 2009, the S&P 500 has produced a total return of over 300%. Profits have not kept up with the share price moves, which has driven equity valuations to highs not seen in over a decade. However, there are still reasons to be optimistic. Yes, markets are expensive, but earnings are growing again after two years, and there is a chance of a “blue sky” scenario (tax reform, deregulation, and infrastructure spend).
Chart 1: Equity Valuation
The post-election rally has continued to drive equity valuations higher. Tax reform, deregulation, and infrastructure are hoped for catalysts.
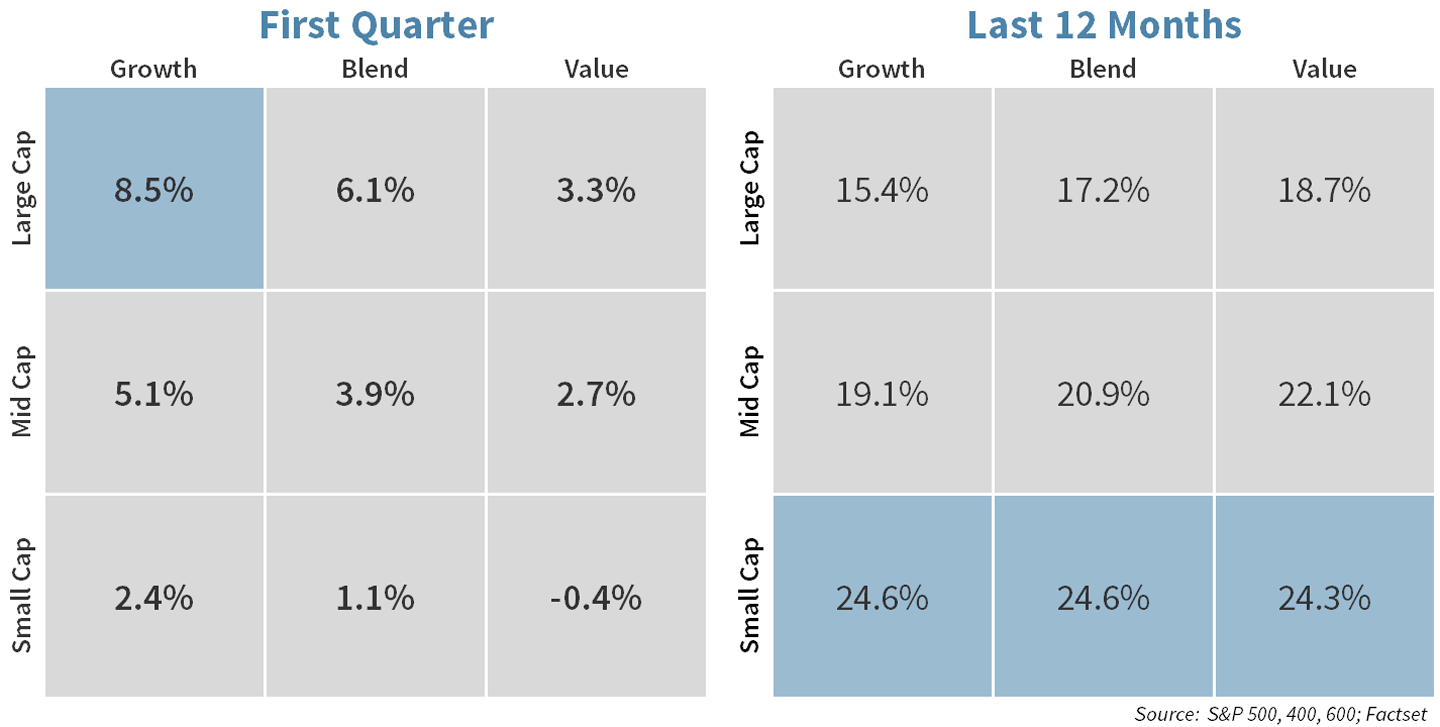
Driving equities in the first quarter were large-cap growth stocks, primarily in the Tech and Health Care sectors. Social media companies like Facebook (FB) took the lead despite already stretched valuations. Small cap stocks have been left behind thus far this year, yet over the past 12 months, they are still the top performers.
Chart 2: U.S. Size and Style Leadership
Large cap growth has replaced small cap value as the market leader in Q1, thanks to strength in large-cap Tech and Health Care.
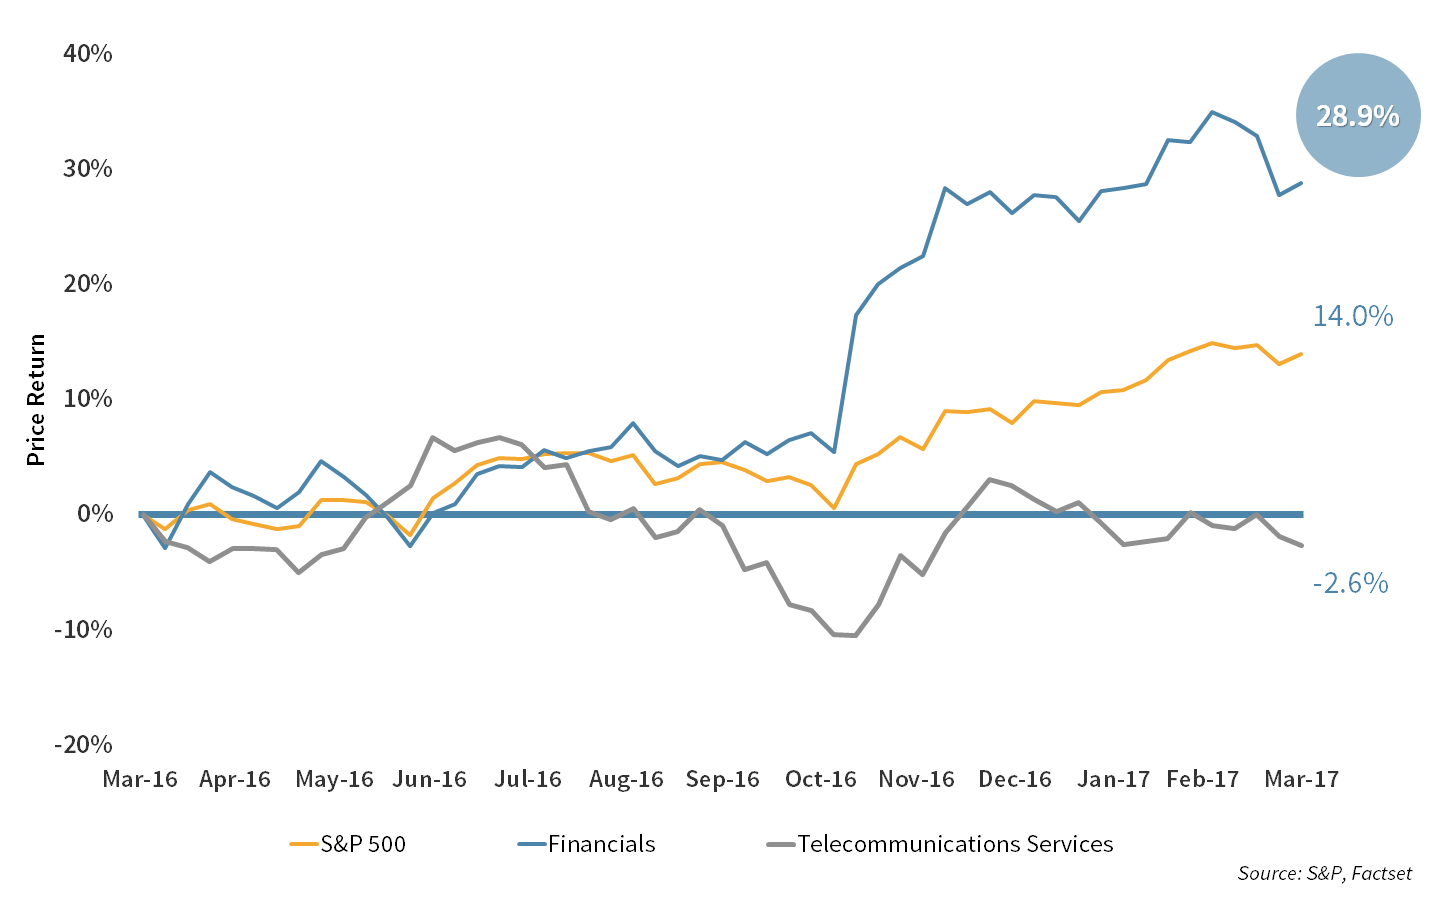
While Tech and Health Care have had a good start to the year, Financials are still the top performers over the past 12 months. They have taken a breather since their post-election rally, but the “blue sky” scenario may be a relevant driver going forward.
Chart 3: Best and Worst Sectors
Financials trod water this quarter, but remain the best performing sector of the past 12 months on tax reform, deregulation and higher rates.
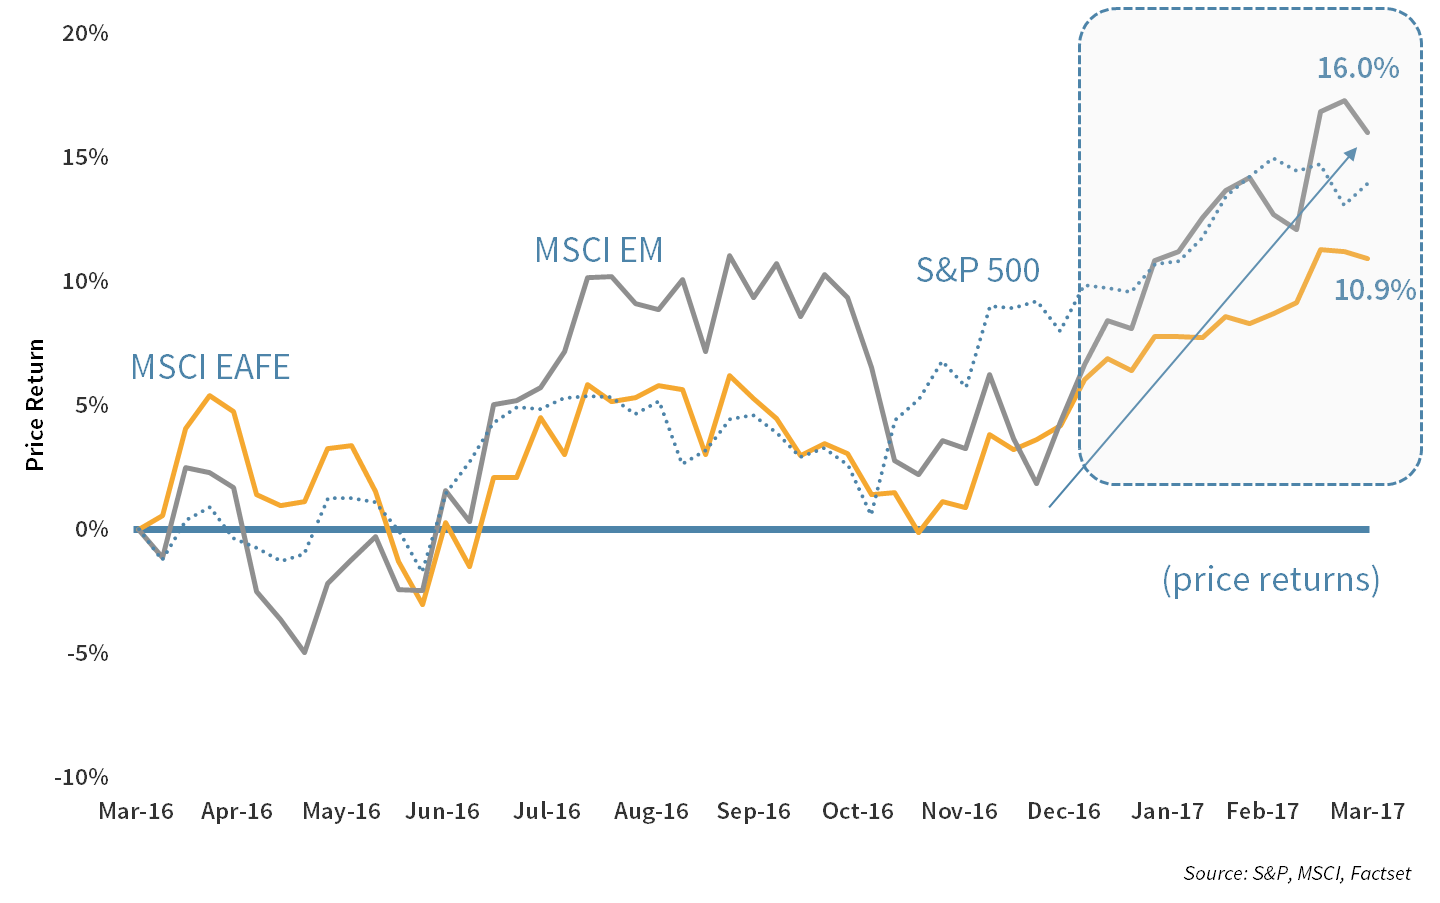
Somewhat surprisingly Emerging Markets have had a robust 2017 thus far. Concerns persist that increased U.S. protectionism could hurt emerging markets. However, metal prices have been driven up by infrastructure spend expectations, and this benefits many EM countries which are heavily exposed to mining. Also, a strong dollar incrementally helps the competitiveness of EM countries.
Chart 4: Global Performance
Emerging Markets have outperformed this year despite concerns of increased U.S. protectionism. A strong dollar could help the competitiveness of EM.
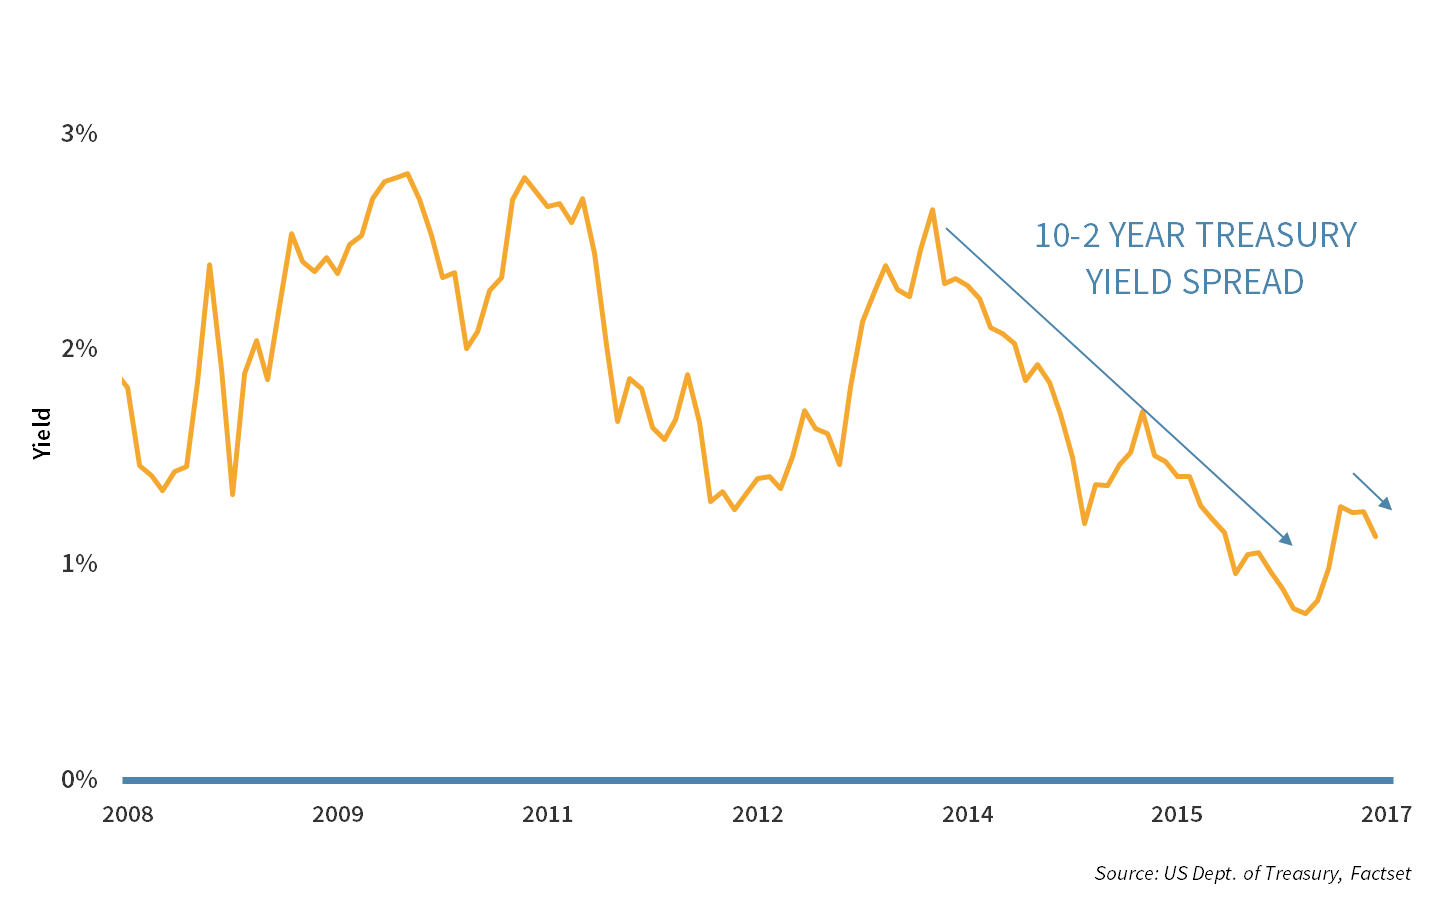
After widening through much of 2016, the spread between the 2-year and 10-year Treasuries narrowed in the first quarter. While the Fed is raising rates at the short end of the curve, the long end is not rising as fast, or at all. This is a challenge for banks that rely on a healthy spread to spur lending. If the spread narrows too much, reduced lending can stagnate economic growth.
Chart 5: Treasury Spread
The rise in the 2-10 spread has stalled. Banks need to see a healthy spread to be incentivized to fund economic growth.
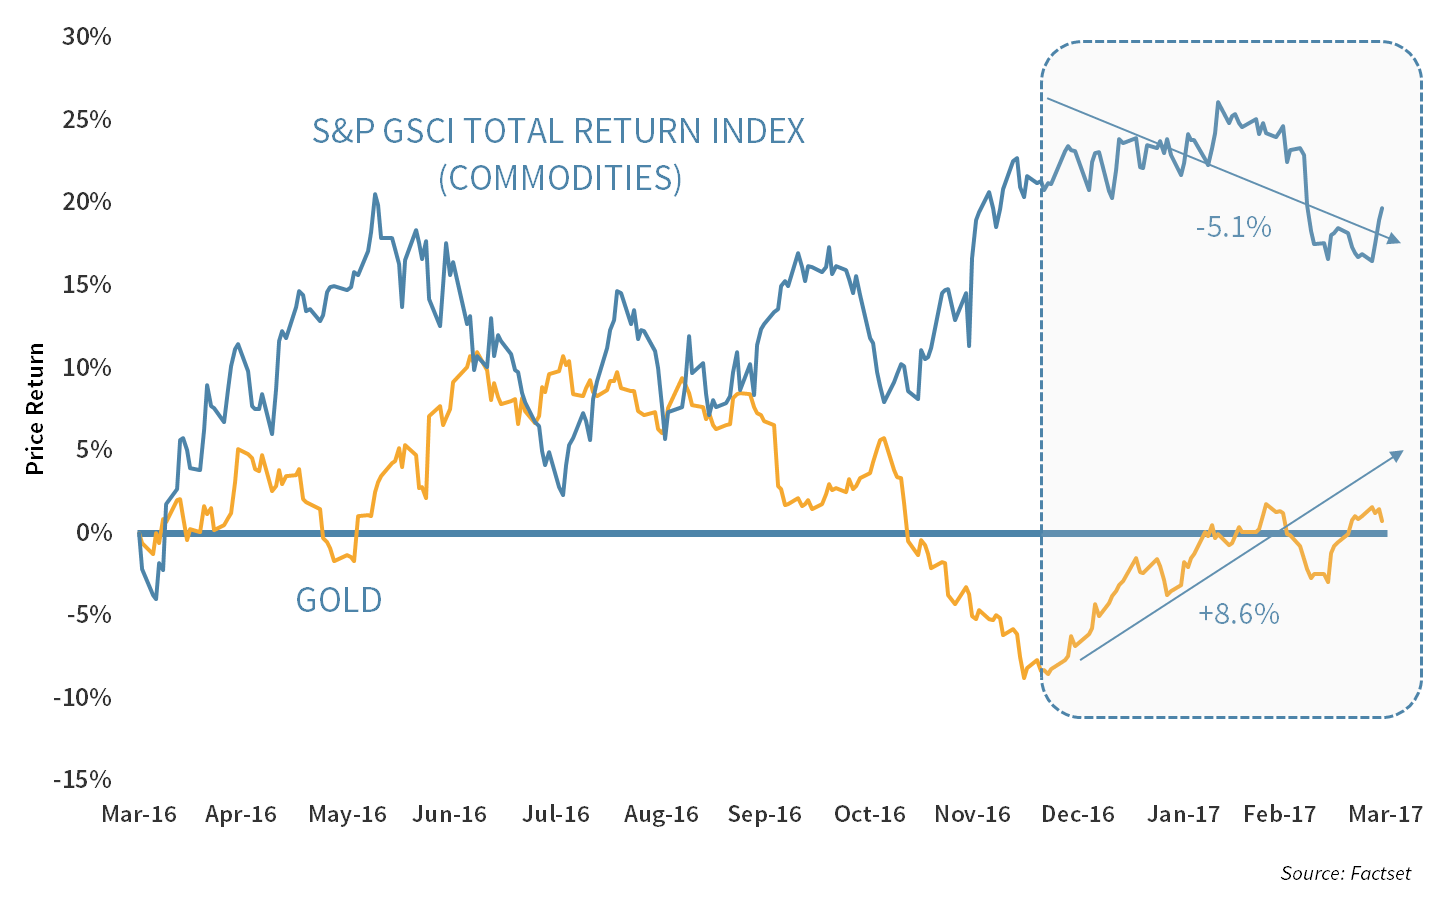
Commodity indices fell sharply in the first quarter. However, oil, which represents the largest portion of these indices, provided most of the weakness. Gold, on the other hand, continues to rise after a weak 2016. In the currently uncertain environment, we see this popular precious metal as a useful diversifier.
Chart 6: Commodities
Commodities indices have declined this year, led by oil which is feeling the impact of rising U.S. supply. Gold posted a strong Q1.
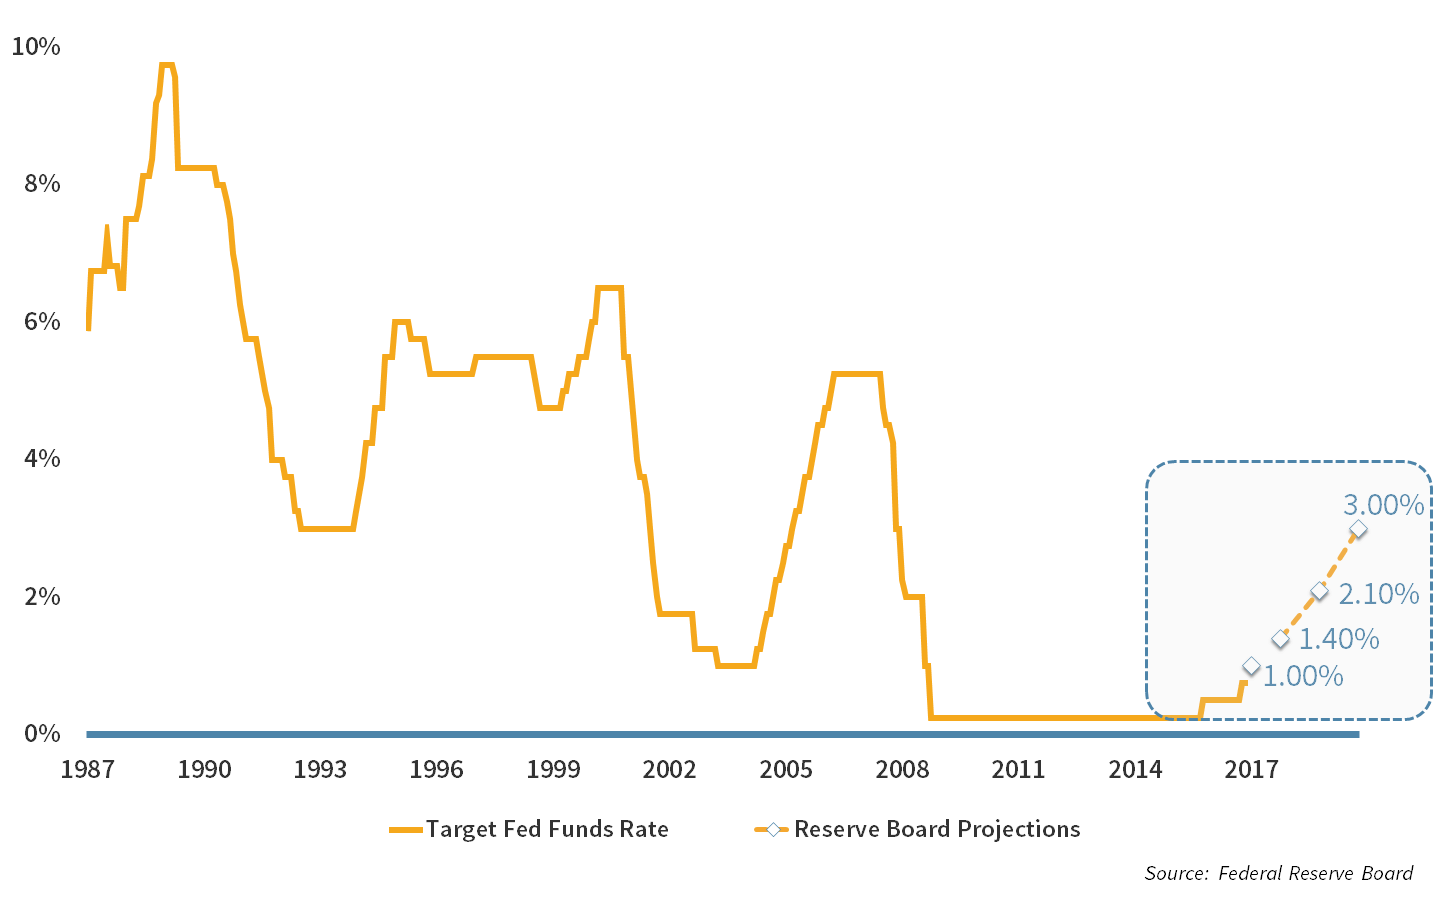
The political scene has consumed much of the financial media’s attention in recent months, and rightfully so. However, actions by the Federal Reserve to raise short-term interest rates are as important as ever. The ¼ of one percent in the Fed Funds rate this quarter has set the stage for a slightly more aggressive Fed than had previously been predicted.
Chart 7: The Fed
The Fed raised rates in March and heightened expectations for additional increases in 2017 and beyond, thanks to rising wages, low unemployment, and…(see chart 8)
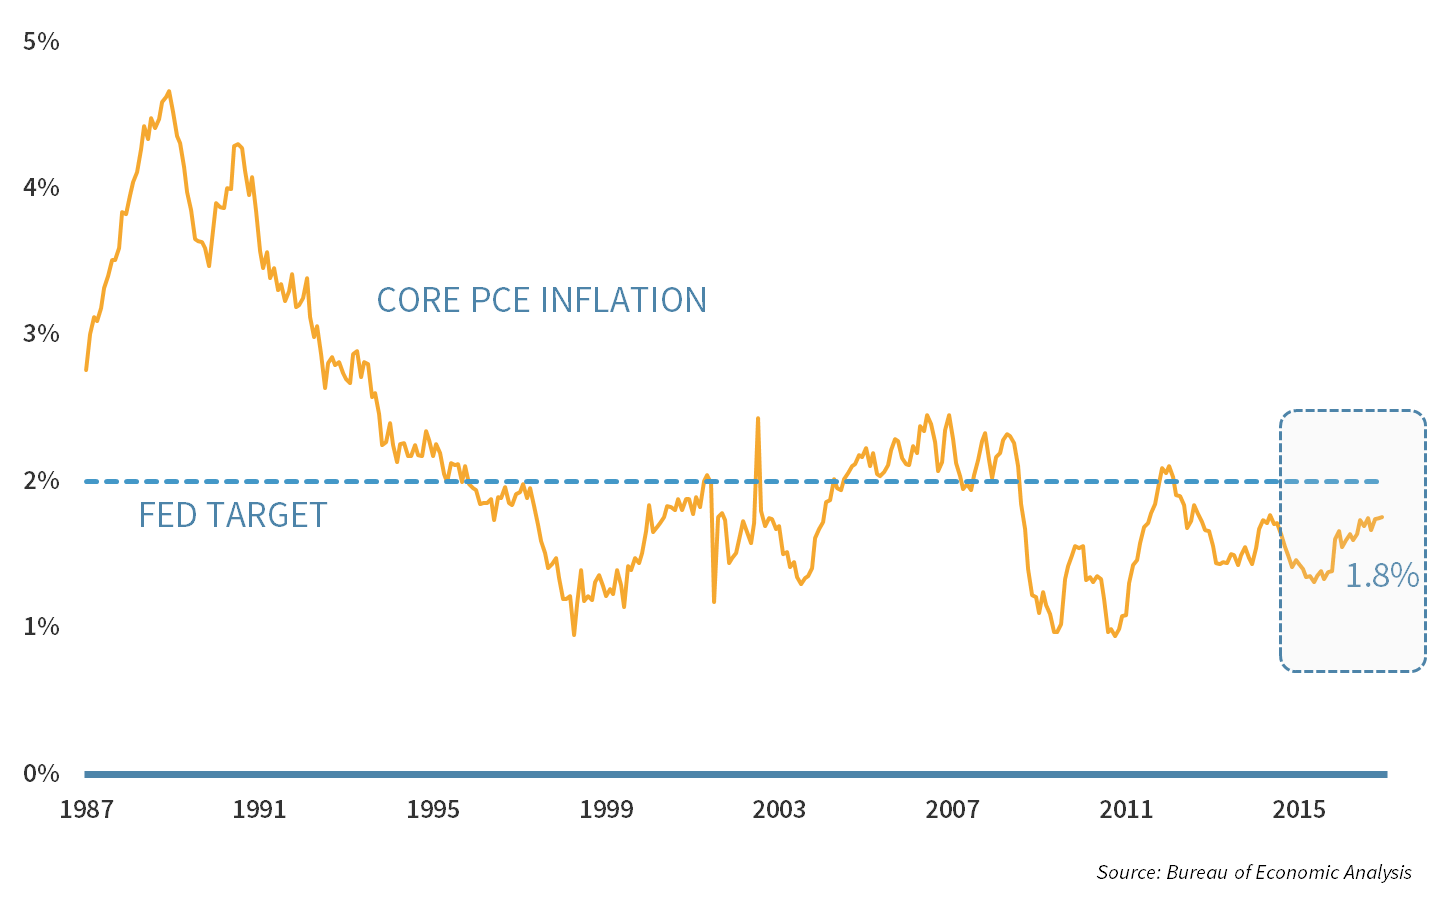
The Fed’s actions are driven by a number of factors, but most importantly: unemployment (which is low and continues to fall), personal consumption (which continues to rise), and inflation (which continues to inch towards the Fed’s 2% target). While rising rates are a tool used by the Fed to slow down an overheating economy, we note two points: 1) rates are still below normal, so these moves are more about normalizing than slowing, and 2) the fact that the Fed is ready to raise rates indicates they have faith in the robustness of the economic recovery.
Chart 8: Inflation
…an inflation rate that is gradually inching towards the Fed’s 2% target.
The Q2 2017 Playbook
Equity valuations are clearly above average, and with bond yields so low, there is little value to be found there either. Despite this, we do not see a need for dramatic portfolio reallocation. There are some tangible catalysts (tax reform, infrastructure spend, deregulation) which could continue to push equities higher. As such, trying to time the market peak, could prove costly. Our playbook for the coming quarter is:
- Focus on Quality and Value which we believe can weather adversity and outperform over the long run. Should the market pull back, we think this approach will help avoid permanent loss of capital.
- Diversify, and be prepared to rebalance to take advantage of any market pullbacks. Market corrections are inevitable. We do not need to predict them; rather we need to prepare for them.
- If equities continue to run higher, we have a modest preference for rebalancing into cash currently. Cash may not earn a return, but it can become a very powerful rebalancing lever in times of weakness.
Market Indices
AS OF MARCH 31, 2017
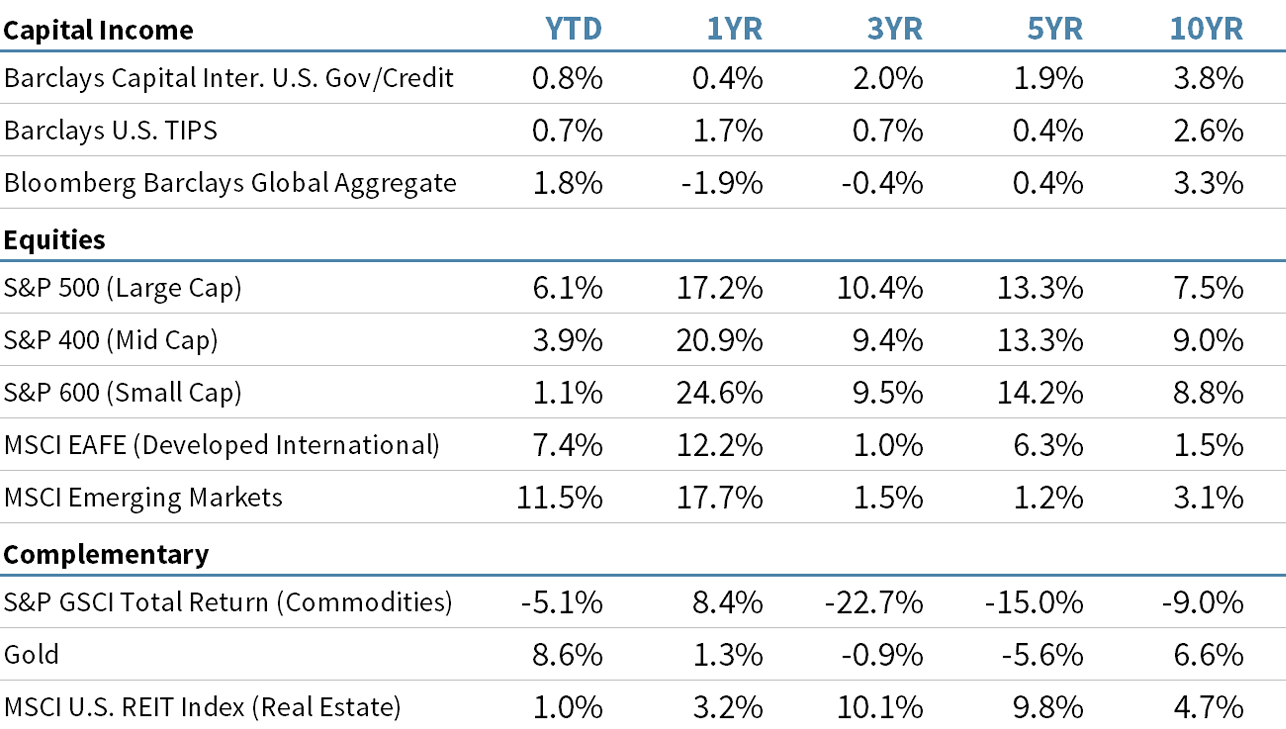
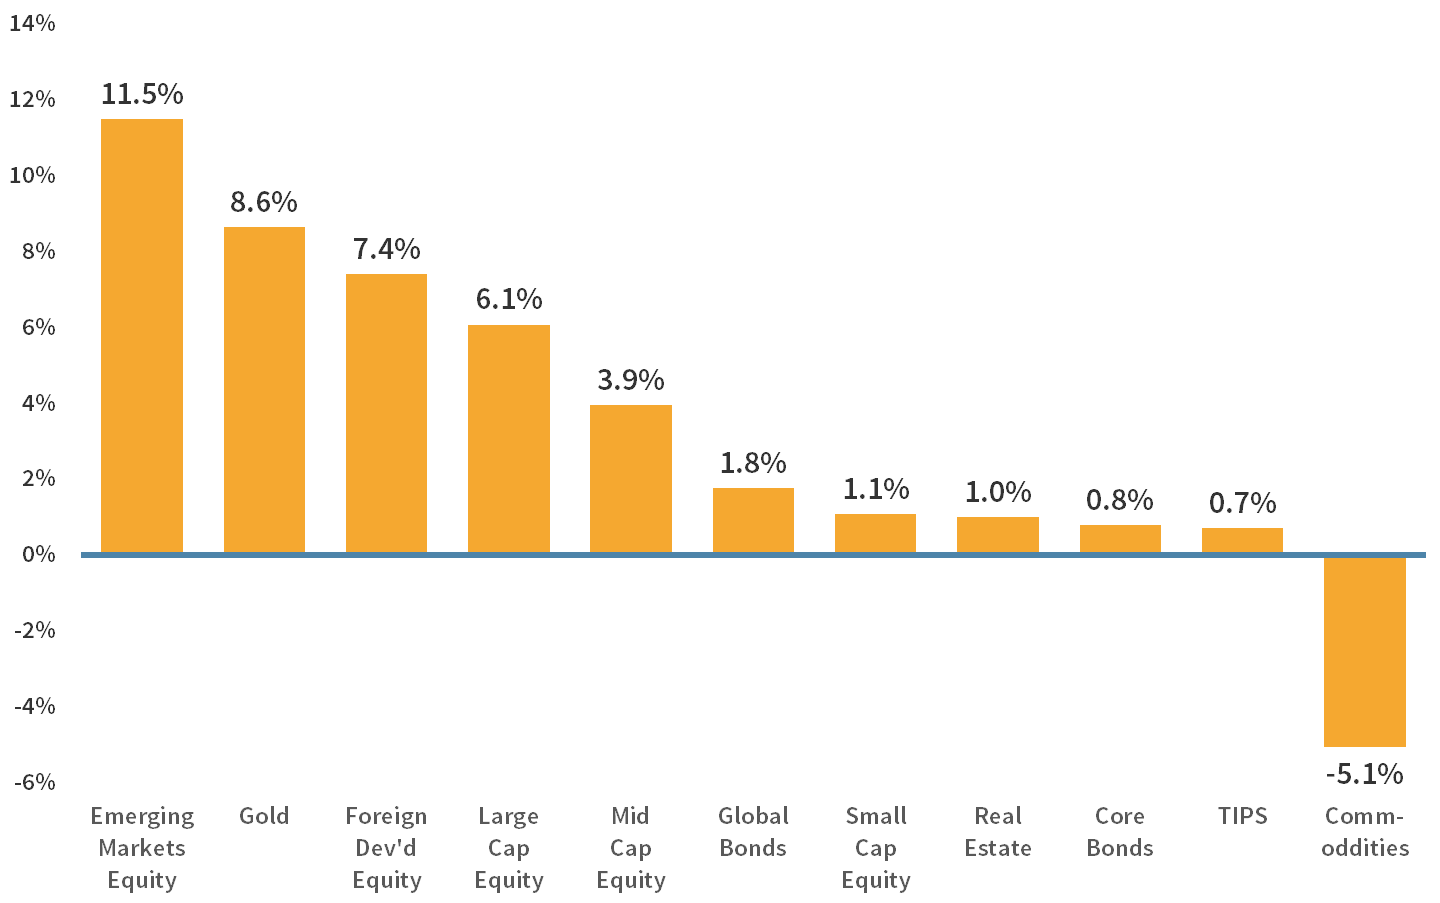
Performance By Asset Class
As of March 31, 201
About Strategic
Founded in 1979, Strategic is a leading investment and wealth management firm managing and advising on client assets of over $2 billion.
OverviewDisclosures
Strategic Financial Services, Inc. is a SEC-registered investment advisor. The term “registered” does not imply a certain level of skill or training. “Registered” means the company has filed the necessary documentation to maintain registration as an investment advisor with the Securities and Exchange Commission.
The information contained on this site is for informational purposes and should not be considered investment advice or a recommendation of any particular security, strategy or investment product. Every client situation is different. Strategic manages customized portfolios that seek to properly reflect the particular risk and return objectives of each individual client. The discussion of any investments is for illustrative purposes only and there is no assurance that the adviser will make any investments with the same or similar characteristics as any investments presented. The investments identified and described do not represent all of the investments purchased or sold for client accounts. Any representative investments discussed were selected based on a number of factors including recent company news or earnings release. The reader should not assume that an investment identified was or will be profitable. All investments contain risk and may lose value. There is no assurance that any investments identified will remain in client accounts at the time you receive this document.
Some of the material presented is based upon forward-looking statements, information and opinions, including descriptions of anticipated market changes and expectations of future activity. Strategic Financial Services believes that such statements, information, and opinions are based upon reasonable estimates and assumptions. However, forward-looking statements, information and opinions are inherently uncertain and actual events or results may differ materially from those reflected in the forward-looking statements. Therefore, undue reliance should not be placed on such forward-looking statements, information and opinions.
No content on this website is intended to provide tax or legal advice. You are advised to seek advice on these matters from separately retained professionals.
All index returns, unless otherwise noted, are presented as price returns and have been obtained from Bloomberg. Indices are unmanaged and cannot be purchased directly by investors.