A Trend Worthy of Attention
 Doug Walters
The S&P 500 bounced back to all-time highs as the market pushed political uncertainty to the background and focused on the tangible evidence of economic strength coming out of corporate America and government bean counters.
Market Revew
Contributed by Doug Walters
Any trepidations investors had last week have fallen by the wayside, as the U.S. stock market rallied and volatility fell back down to historically low levels. A robust finish to the corporate earnings season was backed up by a positive revision to first quarter GDP, providing investors with reasons to be confident that the economy is on solid footing.
Bad Estimates, Good News
The U.S. Bureau of Economic Analysis reported this week that their original estimate of first quarter GDP growth was low… way low in fact. The disappointing initial reading of 0.7% was replaced by a more robust 1.2% figure. Anyone with an eye on first quarter corporate earnings would have seen this coming. With 98% of the S&P 500 now having reported, the results were far better than expected (or perhaps analysts were far worse at estimating than expected). More importantly, is that the results were good in absolute terms. As we discuss in our Economics section, we may finally be seeing the long-awaited robust growth in sales needed to help justify elevated stock valuations
| Indices & Price Returns | Week (%) | Year (%) |
|---|---|---|
| S&P 500 | 1.4 | 7.9 |
| S&P 400 (Mid Cap) | 0.9 | 4.1 |
| Russell 2000 (Small Cap) | 1.1 | 1.8 |
| MSCI EAFE (Developed International) | 0.5 | 12.4 |
| MSCI Emerging Markets | 1.9 | 17.7 |
| S&P GSCI (Commodities) | -2.0 | -3.8 |
| Gold | 1.0 | 10.0 |
| MSCI U.S. REIT Index | 0.5 | -0.4 |
| Barclays Int Govt Credit | -0.1 | 1.0 |
| Barclays US TIPS | -0.2 | 1.1 |
Economic Commentary
Contributed by Doug Walters
The Return of Revenue Growth
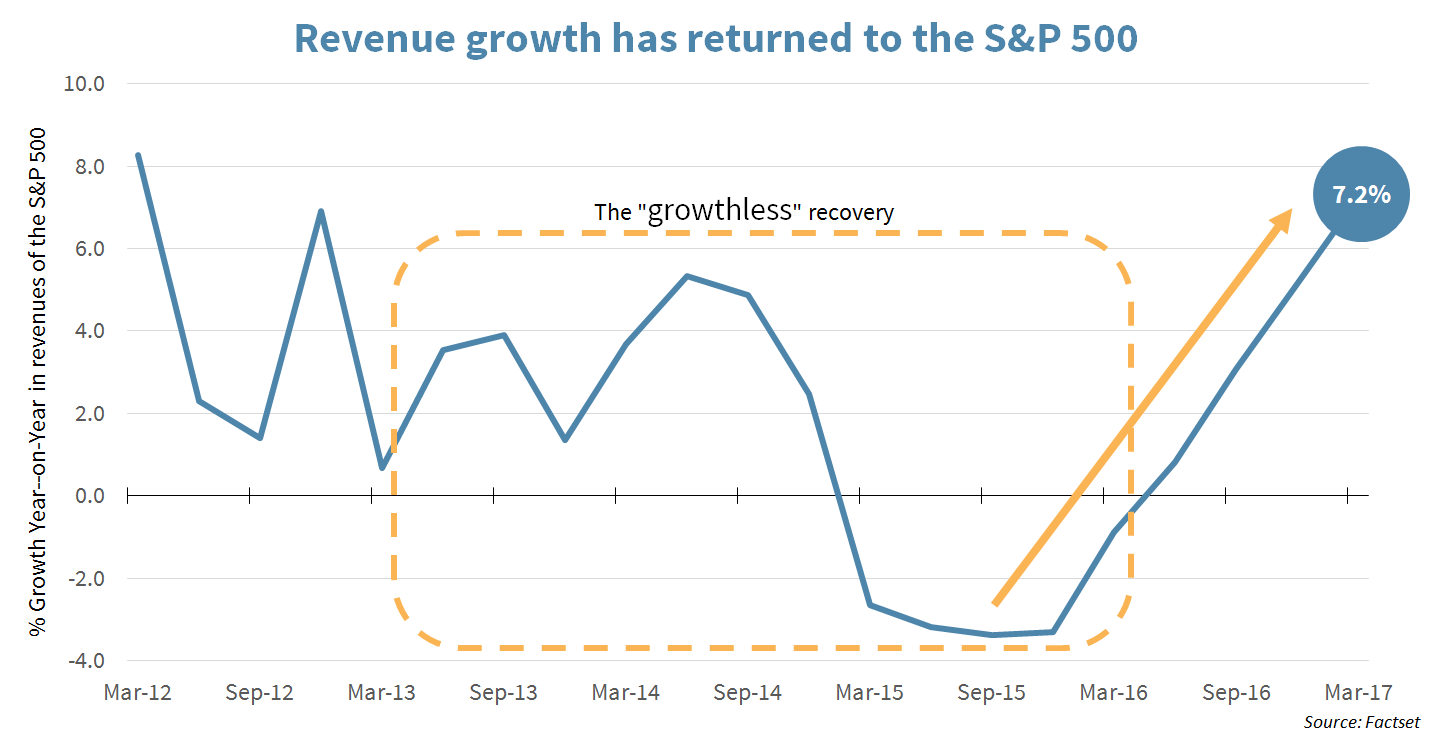
For years since the Financial Crisis of 2008, we have heard about the “growthless” recovery. While companies have been reporting earnings per share growth, top line growth (i.e., revenues) has been tepid. This has sparked concerns that the recovery from the economic lows of the crisis has been manufactured through share buybacks and other forms of financial engineering.
However, as we wrap up the Q1 2017 corporate reporting season, we note a very distinct trend in revenue growth. Compared to Q1 2016, sales are up 7.2%. More than that, as the chart below shows, there has been steady improvement in top line growth since December 2016.
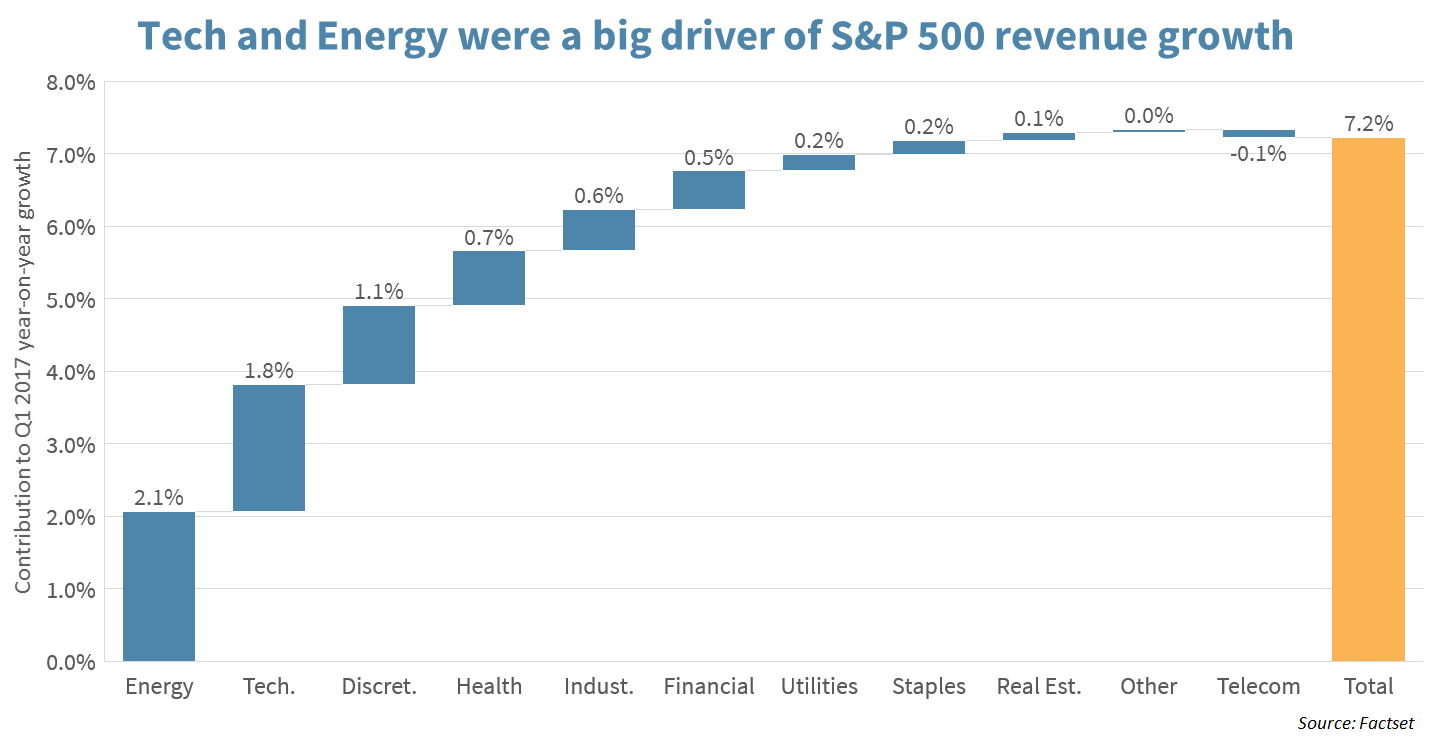
Digging into the data, we find that this growth has been driven recently by a sharp bounce back in Energy (from a very low base), as well as strength in Tech and Consumer Discretionary (see chart below). While some retailers are struggling with the dominance of online sales, clearly the consumer is still spending.
Recent speculation is that the impressive performance of the S&P 500 has been driven by hopes of corporate-friendly actions in Washington (such as tax reform, reduced regulation and infrastructure spend). However, investors may have lost sight of the fact that we have been experiencing a genuine improvement in fundamentals, the extent to which we have not seen for some time. We believe this is another reason for nervous investors to think twice about trying to time an exit out of this equity rally.
The Week Ahead
IMPACT Investing
Institute of Supply Management Manufacturing Survey for May will be released this week.
- A reading of 54.6 is expected versus last month’s 54.8 reading. Above 50 indicates growth.
Memorial Day is on Monday. Both stock and bond markets are closed.
- Enjoy the long weekend and remember to honor those who paid the ultimate price for our freedom.
Personal Income is expected to increase by 0.40% while pending home sales are expected to increase by 0.60%.
ADP and Non-Farm Payrolls have continued to show strength this year, while unemployment has declined to near historic low levels. Analysts’ consensus for this week’s reports are the following:
- The ADP report is expected to show an increase of 180,000 jobs in May, while the expected growth in non-farm payrolls is 175,000.
Consumer Confidence is expected to remain near historic highs for the month of April. As discussed in the Economics section, we may be finally seeing high consumer confidence translate into steady revenue growth.
Trade deficit has been fluctuating around $43 billion (+/- $5 billion) per month since 2012 and is expected to increase to $44.3 billion in April.
- The trade deficit reached a low in 2006 when it averaged around $60 billion per month.
- American companies like Apple contribute to these figures, as their products are largely imported into the U.S., thus widening the U.S.-China trade deficit.
Strategy Update
Contributed by Max Berkovich ,
STRATEGIC ASSET ALLOCATION
Caught in the Middle
Mid-capitalization stocks made significant performance strides last year after the election, but this year appear to be patiently waiting for large cap stocks to catch up. Mid-caps (tracked by S&P Mid Cap 400 index), had outperformed large cap by more than 5% after the election. However, with the S&P 500 index up nearly 8% year-to-date, that gap has closed to 1%.
- The S&P Mid Cap 400 index is up around 4% year-to-date, after a near 21% return in 2016.
- The S&P 500’s performance has been helped by the Tech sector, which is up almost 20% year to date.
- Apple (AAPL), Google (GOOG, GOOGL), Amazon (AMZN), Facebook (FB) and Microsoft (MSFT) combined make up 11.8% of the S&P 500 Index and are up on average over 27% so far in 2017.
- Amazingly, Google (GOOG, GOOGL) and Apple (AAPL) are now each bigger than the Utilities, Telecom, Materials and Real estate sectors in the S&P 500 index!
STRATEGIC GROWTH
The Cost of Beauty
With crude prices dipping under $50 per barrel it is not surprising that the Energy sector had another forgettable week. Health Care, on the other hand, had a phenomenal week led by pharmaceutical distributor McKesson Corp. (MCK) who reported a consensus-topping quarter. Speaking of earnings…
- Ulta Beauty (ULTA) reported another dazzling quarter with another beat and raise earnings report. Comparable sales in the quarter were 14% higher and eCommerce was up 71%. The company served up guidance of 9-11% sales growth and 50% sales growth in eCommerce for the full year 2017.
- Also, Costco Wholesale Corp. (COST) topped expectations when it announced 3rd quarter earnings. Results included 8% net sales growth for the quarter, with comparable sales up 5% overall and up 6% for the company’s 510 U.S. stores.
STRATEGIC EQUITY INCOME
Pumped Up
Utilities had an electric week despite a mostly uneventful week from the bond market. The Energy sector was the laggard. In other strategy news…
- Medical equipment maker Medtronic Plc. (MDT) reported an in-line quarter, but it was the guidance that investors were focused on. The company did not disappoint. Management guided for 4-5% revenue growth and a 9-10% earnings per share boost for 2018. The company also guided for long-term earnings growth in the double digits. A big boost to growth is expected to come from the diabetes unit. The company is guiding for 10-12% revenue growth for 2018, thanks to a robust pipeline and growth in demand for insulin pumps.
About Strategic
Founded in 1979, Strategic is a leading investment and wealth management firm managing and advising on client assets of over $2 billion.
OverviewDisclosures
Strategic Financial Services, Inc. is a SEC-registered investment advisor. The term “registered” does not imply a certain level of skill or training. “Registered” means the company has filed the necessary documentation to maintain registration as an investment advisor with the Securities and Exchange Commission.
The information contained on this site is for informational purposes and should not be considered investment advice or a recommendation of any particular security, strategy or investment product. Every client situation is different. Strategic manages customized portfolios that seek to properly reflect the particular risk and return objectives of each individual client. The discussion of any investments is for illustrative purposes only and there is no assurance that the adviser will make any investments with the same or similar characteristics as any investments presented. The investments identified and described do not represent all of the investments purchased or sold for client accounts. Any representative investments discussed were selected based on a number of factors including recent company news or earnings release. The reader should not assume that an investment identified was or will be profitable. All investments contain risk and may lose value. There is no assurance that any investments identified will remain in client accounts at the time you receive this document.
Some of the material presented is based upon forward-looking statements, information and opinions, including descriptions of anticipated market changes and expectations of future activity. Strategic Financial Services believes that such statements, information, and opinions are based upon reasonable estimates and assumptions. However, forward-looking statements, information and opinions are inherently uncertain and actual events or results may differ materially from those reflected in the forward-looking statements. Therefore, undue reliance should not be placed on such forward-looking statements, information and opinions.
No content on this website is intended to provide tax or legal advice. You are advised to seek advice on these matters from separately retained professionals.
All index returns, unless otherwise noted, are presented as price returns and have been obtained from Bloomberg. Indices are unmanaged and cannot be purchased directly by investors.