The Midterm Effect
 Doug Walters
The mid-term elections have a surprising historical correlation with stock market performance. We dig into the numbers in this edition of Insights…
Market Review
Contributed by Doug Walters
U.S. stocks rebounded this week, albeit with a fizzle Friday thanks to disappointing Apple (AAPL) earnings. The cause of the rebound was no better explained than the preceding decline, with investors pointing to “an oversold market” and “program trading.” The midterm elections are undoubtedly playing into investor calculus, and with two more days of trading before votes get tallied, we look at history for guidance.
Skewed to the Upside
The midterm elections are just days away, and if you are in a contested district like we are, you are well aware. The airwaves are bombarded with a record level of advertising (sadly most of it negative). Even my kids have taken notice, asking me when the commercials about the “bad politicians” will stop. Soon! So, what does it mean for equities?
We would need the elusive crystal ball to answer this question, using it to predict, first which party takes that House and Senate, then the impact that would have on our investment portfolios. Neither of these is knowable with certainty, and investors are better off owning a robust, diversified portfolio which is prepared for uncertainty and does not require fortune telling.
But take heart, as history is on your side. We looked at the stock market’s performance in the six months (following October) in years of both Presidential and midterm elections. Going back to 1928, the 6-month return after a Presidential election averaged 3.7%, compared to 12.0% for a midterm year! The chart below shows an impressively consistent skew in midterm years!
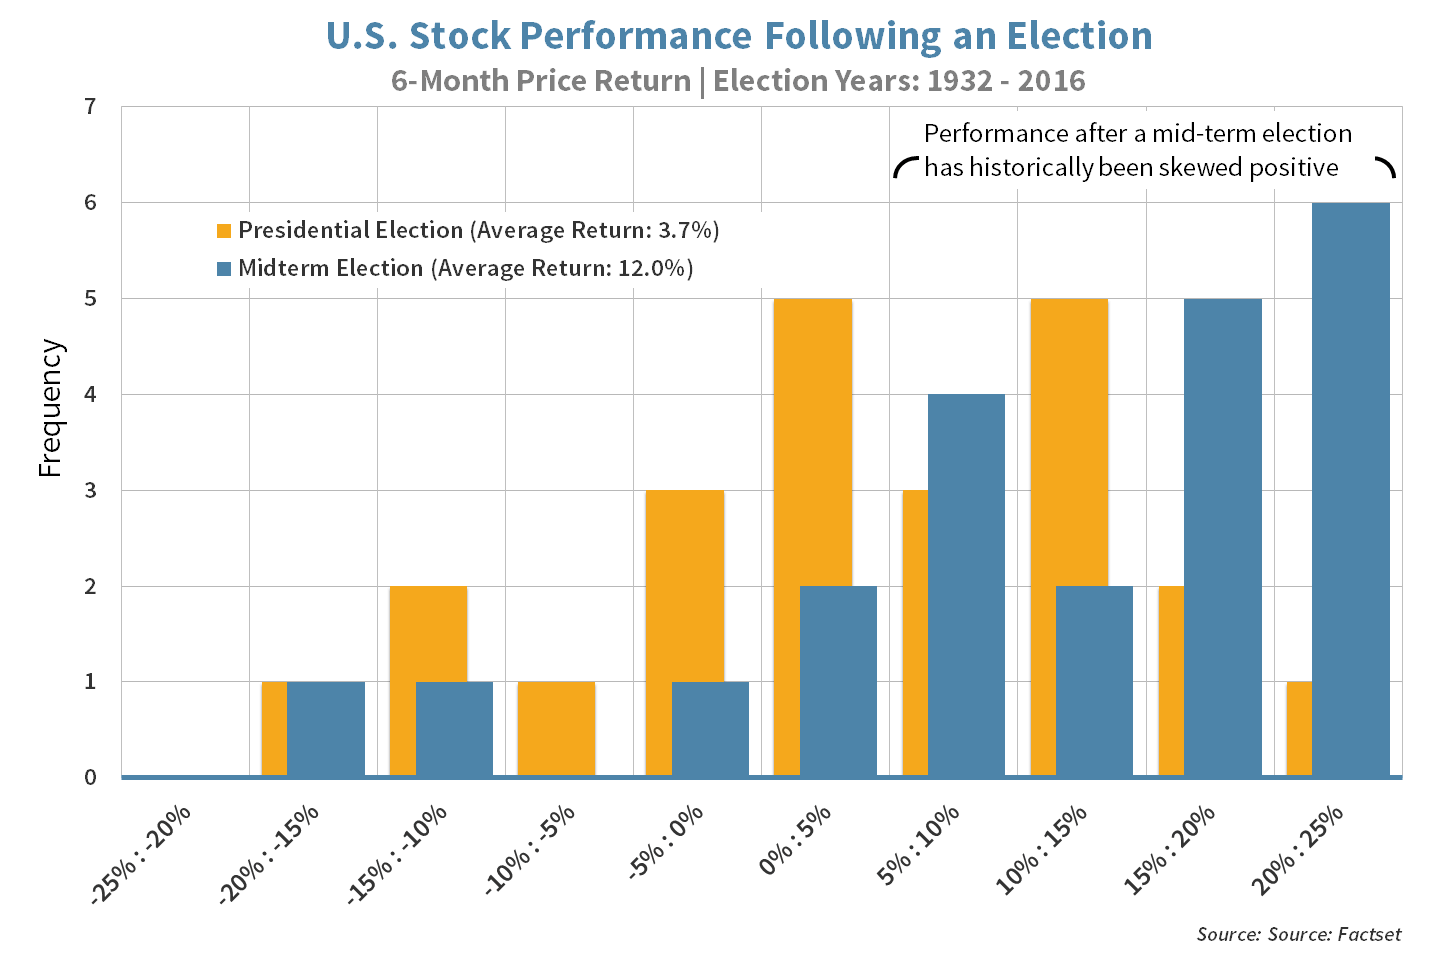
Before you go and double-down on equities, I would warn that I offer no scientific basis for this phenomenon, and there were a few years where returns were negative. Instead, use this data as a little comfort blanket in a time of uncertainty.
Strategy Update
Contributed by Max Berkovich ,
STRATEGIC ASSET ALLOCATION
Observation Deck
Global equities managed to bounce back from their recent lows this week. Developed and emerging markets along with small-cap domestic stocks have rallied the most. The return of volatility in October gave insight into which assets classes have investors on edge. Our observations include…
- Growth and momentum stocks have declined the most. While this outcome is expected during a flight to safety, both assets still lead the way with year-to-date outperformance relative to other subsections of large-cap domestic equities.
- Value stocks stayed true to their historical norms, outperforming growth stocks in October.
- Small-cap domestic stocks outperformed as well, most likely because the asset class’ valuation looks more attractive relative to its history.
- International equities moved lockstep with their domestic peers, despite a valuation disparity in their favor.
- Gold performed very well during October, finishing the month 2% higher, but still down for the year. The “safe haven” reputation of gold helped it to appreciate, despite a strong U.S. dollar.
Fixed income maintained its value in October, performing its capital protection role well.
STRATEGIC GROWTH
Just Beat It
The lone holding in the Energy sector was a laggard during a strong week for the strategy. Consumer Staples was the leading sector thanks to….
- Church & Dwight Co. Inc. (CHD) the consumer products company had a particularly good quarterly report. Most consumer staple peers where hurt by currency and had slow or no growth, but not Church & Dwight. The company’s sales are predominantly domestic, so no currency issues. The company had organic sales growth of 4.7% in the quarter and expects full-year sales growth of over 9%. Not bad for a company known for its Arm & Hammer baking soda and OxiClean detergent.
- Also, NXP Semiconductors NV (NXPI) reported a strong quarter. The company proved the skeptics wrong and showed growth within its automotive segment.
STRATEGIC EQUITY INCOME
Upsetting the Apple Cart
The Discretionary sector roared back from the October lull to be the leading sector this week. Technology was the laggard thanks to an earnings report from…
- Apple Inc. (AAPL) failed to impress investors with its earnings. While the biggest company in the world beat expectations, guidance was cause for caution. Next quarter guidance, which includes the holiday season is expected to generate $89 to $93 Billion in sales. Analysts are expecting $92.9 Billion. Also, analysts are expecting iPhone shipments of 47.5 Million units; the company is guiding to 46.9 Million. The light guidance and notable weakness in China, was further complicated with the company announcing it will no longer provide iPhone sales figures.
The Week Ahead
When Election Uncertainty Fades, the Market Can Get out of the MIRE
Midterm elections will take place on Tuesday, November 6th.
- All 435 seats in the House of Representatives are up for election, but eyes will be on the 29 races that are currently a toss-up according to The Cook Political Report. Democrats need to net 23 seats to wrestle away control from Republicans.
- 35 of 100 Senate seats are up for grabs, with a slim 51-49 majority, Republicans need to grab one of the six toss-up races to maintain control.
- Also, 39 Governorships are on the ballot, along with numerous local races.
- Exercise your political freedom and get out and vote!
Interest rate decision from the U.S. Fed will be announced on Thursday.
- No rate hike is expected, but any comments around further tightening of the monetary policy may bring some volatility to fixed income markets, especially after a volatile October in the markets.
Redbook, Non-Manufacturing (ISM), Purchasing Managers Index (PMI), and Job Openings and Labor Turnover Survey (JOLTS) will be released ahead of the elections and Fed decision.
- None of the releases should impact the election.
Earnings from eight companies in our Strategic Growth strategy are on the calendar, but Disney (DIS), Booking Holdings (BKNG), Qualcomm (QCOM), and Skyworks (SWKS) should be the ones of note. CVS Health (CVS) is the lone company from our Equity Income strategy due to report next week.
| Indices & Price Returns | Week (%) | Year (%) |
|---|---|---|
| S&P 500 | 2.4 | 1.8 |
| S&P 400 (Mid Cap) | 3.6 | -2.1 |
| Russell 2000 (Small Cap) | 4.3 | 0.8 |
| MSCI EAFE (Developed International) | 2.7 | -10.9 |
| MSCI Emerging Markets | 3.4 | -16.1 |
| S&P GSCI (Commodities) | -3.7 | 1.9 |
| Gold | -0.1 | -5.7 |
| MSCI U.S. REIT Index | 0.1 | -4.7 |
| Barclays Int Govt Credit | -0.6 | -3.0 |
| Barclays US TIPS | -1.1 | -5.1 |
About Strategic
Founded in 1979, Strategic is a leading investment and wealth management firm managing and advising on client assets of over $2 billion.
OverviewDisclosures
Strategic Financial Services, Inc. is a SEC-registered investment advisor. The term “registered” does not imply a certain level of skill or training. “Registered” means the company has filed the necessary documentation to maintain registration as an investment advisor with the Securities and Exchange Commission.
The information contained on this site is for informational purposes and should not be considered investment advice or a recommendation of any particular security, strategy or investment product. Every client situation is different. Strategic manages customized portfolios that seek to properly reflect the particular risk and return objectives of each individual client. The discussion of any investments is for illustrative purposes only and there is no assurance that the adviser will make any investments with the same or similar characteristics as any investments presented. The investments identified and described do not represent all of the investments purchased or sold for client accounts. Any representative investments discussed were selected based on a number of factors including recent company news or earnings release. The reader should not assume that an investment identified was or will be profitable. All investments contain risk and may lose value. There is no assurance that any investments identified will remain in client accounts at the time you receive this document.
Some of the material presented is based upon forward-looking statements, information and opinions, including descriptions of anticipated market changes and expectations of future activity. Strategic Financial Services believes that such statements, information, and opinions are based upon reasonable estimates and assumptions. However, forward-looking statements, information and opinions are inherently uncertain and actual events or results may differ materially from those reflected in the forward-looking statements. Therefore, undue reliance should not be placed on such forward-looking statements, information and opinions.
No content on this website is intended to provide tax or legal advice. You are advised to seek advice on these matters from separately retained professionals.
All index returns, unless otherwise noted, are presented as price returns and have been obtained from Bloomberg. Indices are unmanaged and cannot be purchased directly by investors.