Supernomics
 Doug Walters
With Super Bowl 50 around the corner, we take the opportunity to look at how the economics of advertising during the big game have changed over time.
Economic Commentary
Contributed by Doug Walters , Kasey Williams
30 seconds of fame
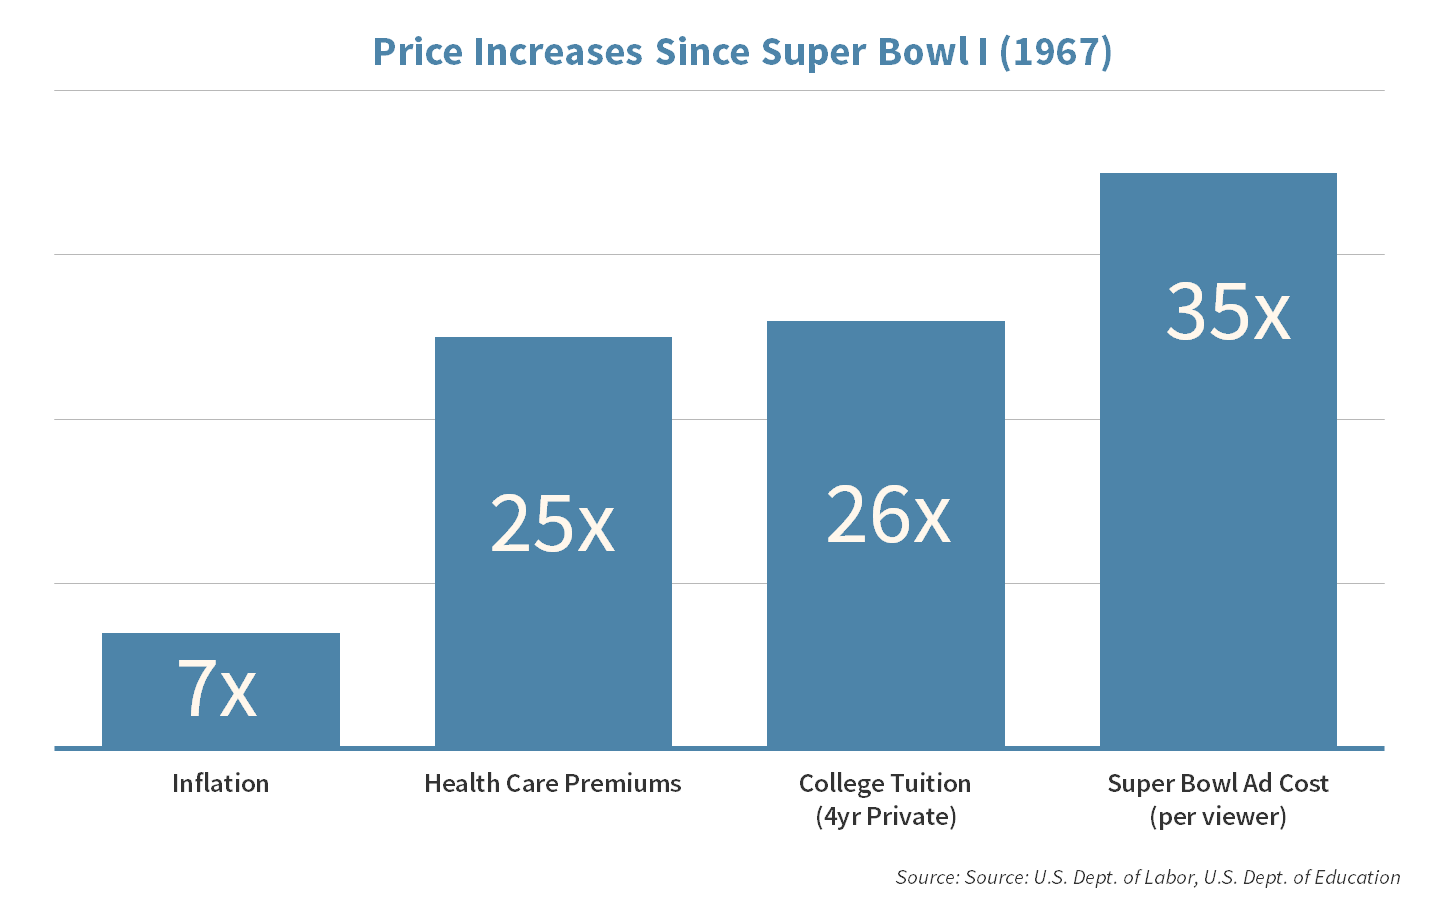
This year, the cost of a 30 second Super Bowl ad is going for as much as $5 million. That is a far cry from the $40K that one would have paid during Super Bowl 1 back in 1967. Could this 125x increase be explained by inflation? Not even close. Since 1967, normal inflation would imply an increase of a bit more than 7x or a $280K ad price.
Other high flyers
Perhaps Super Bowl advertising has followed the same trends we have seen in higher education and health care expenses. We are all painfully aware of the dramatic increases in tuition and insurance premiums in recent decades. However, their ascension pales in comparison, having “only” grown 25x since 1967.
Factoring in eyeballs
However, one key piece of data we have ignored is viewership. While Super Bowl 1 had an impressive audience of 51m, today’s games can draw in over 170m globally; and the best ads may get another 10 million plus views through outlets like YouTube. Yet even if we look at cost per viewer, advertisers have still seen a 35x increase in the cost of their 30 second spot.
Supernomics
No matter how we slice it, the rise in Super Bowl ad costs is nothing short of spectacular. In the end it comes down to economics. As long companies see a reasonable return on their investment, they will continue to play the game.
Market Review
Contributed by Alan Leist, III
After a brief respite, U.S. stocks kicked off February with a return to the selling pressure that marked the start of the year. Disappointing technology earnings and conflicting economic data were the primary culprits.
Punt
Worries about a slowdown in corporate spending and a potential recession found a voice this week in the form of earnings disappointments in the tech sector.
- Cloud company Tableau Software (DATA) and business networking giant Linkedin (LNKD) were both down more than 40% on earnings misses and weak guidance.
- The poor results were just two among many. The damage spread across tech heavy NASDAQ (-3% Fri)
- Side note: Strategic does not invest in either stock as they fail the Quality/Value test anchoring our portfolios.
Spin Move
Bulls and bears both found something to cheer about in Friday’s job reports. The market is the ultimate judge, however, and the play was to sell stocks.
- Despite a disappointing headline number, the new recovery low for unemployment (4.9%) and improving wage growth may bring the next Fed rate hike back into play sooner than expected as the U.S. economy may yet prove to be resilient.
Week Ahead
Contributed by Aaron Evans
Cola Wars
What better way to highlight the years of advertising battles between the two “sultans of soda”, than to follow-up the Super Bowl with Strategic holdings Coca Cola and Pepsi reporting Q4 earnings next week.
- Expect Pepsi to highlight its diverse portfolio of brands that extends into the snack space (vs. Coca Cola which only has beverages) as both companies try to adapt to an increasingly health conscious consumer base.
Expect Pepsi to highlight its diverse portfolio of brands that extends into the snack space
aaron Evans, Senior Advisor
Live Free or Die
The presidential races take us to New Hampshire Tuesday for the next key primary vote on the road to White House candidacy.
- On the GOP side, Donald Trump is going all out in the Granite State after losing Iowa to Ted Cruz. Marco Rubio is right on their heels.
- For the Democrats, Bernie Sanders from neighbor state Vermont leads Hillary Clinton in the polls, but by a narrowing margin heading into Tuesday.
Spend Trends
After Americans stock up on jerseys, beer, chips and tomato pie for the big game, we get an opportunity to check in on January’s retail sales data on Friday.
- Estimates are anticipating year-over-year growth in January, following lower numbers in December from a year prior, spurred by an unseasonably warm winter.
Investment Strategy
Contributed by David Lemire , Max Berkovich
Strategic Asset Allocation
Go Long!
Duration has been a go to play this year as longer dated Treasuries have been one of the stronger performers thus far. Fed quarterbacking has been behind this drive for income, but the long-bond can be a risky play should the Fed’s arm tire from launching so many bombs these past few years. Re-kindled economic growth causing higher rates could stop investors seeking to replicate past successful drives.
Safety
Gold is reprising its safe haven role as this year’s volatility has seen the metal approach double digit gains. Gold gains recently have been nearly as rare as this two-point play.
Omaha!!
When markets experience dislocation, we are prepared to call an audible. Small cap U.S. stocks have underperformed significantly the past few years. We have watched the shifting valuations and made the call to add to our position which had been underweight for years.
Both sides of the ball
This year’s volatility has highlighted our approach on both defense and offense. We focus on maintaining a solid defense on the bond side of portfolios as we aim to protect capital. While we are more opportunistic on the equity side of portfolios, we remain committed to a disciplined process focused on Quality, Value and Diversification. Helping our clients reach their goals is our Lombardi Trophy.
Strategic Growth
Something to Snack on
The materials sector put in a winning week, while Consumer Staples had a breakdown in its defensive line. Most of the move was due to one former star player…
- Snack food giant Mondelez Int’l Inc. (MDLZ) reported a weak quarter, but it was the guidance that caused the fumble. European results came in light and the strong U.S. dollar added to the pressure. Guidance was light, but the company still expects double digit growth.
Strategic Equity Income
Hurry-up Offense
Dividends keep playing a strong defensive game as Utilities and Telecom led the way this week. Technology couldn’t take the pressure. In other news…
- Industrial supply company Fastenal Co. (FAST) reported sales growth for the month of January. Daily sales are growing at a 3.3% rate. While that news in itself was positive, fears of an industrial slowdown in the U.S. were eased on surprising news of 9 new store openings. Last year that number was zero. It may be a sign that the company is ready to grow store count again.
| Indices & Price Returns | Week (%) | Year (%) |
|---|---|---|
| S&P 500 | -3.1 | -8.0 |
| S&P 400 (Mid Cap) | -2.9 | -8.5 |
| Russell 2000 (Small Cap) | -4.6 | -13.1 |
| MSCI EAFE (Developed International) | -0.5 | -7.7 |
| MSCI Emerging Markets | -0.4 | -6.9 |
| S&P GSCI (Commodities) | -2.3 | -5.8 |
| Gold | 4.9 | 10.6 |
| MSCI U.S. REIT Index | -2.1 | -5.5 |
| Barclays Int Govt Credit | 0.2 | 1.4 |
| Barclays US TIPS | 0.0 | 1.6 |
About Strategic
Founded in 1979, Strategic is a leading investment and wealth management firm managing and advising on client assets of over $2 billion.
OverviewDisclosures
Strategic Financial Services, Inc. is a SEC-registered investment advisor. The term “registered” does not imply a certain level of skill or training. “Registered” means the company has filed the necessary documentation to maintain registration as an investment advisor with the Securities and Exchange Commission.
The information contained on this site is for informational purposes and should not be considered investment advice or a recommendation of any particular security, strategy or investment product. Every client situation is different. Strategic manages customized portfolios that seek to properly reflect the particular risk and return objectives of each individual client. The discussion of any investments is for illustrative purposes only and there is no assurance that the adviser will make any investments with the same or similar characteristics as any investments presented. The investments identified and described do not represent all of the investments purchased or sold for client accounts. Any representative investments discussed were selected based on a number of factors including recent company news or earnings release. The reader should not assume that an investment identified was or will be profitable. All investments contain risk and may lose value. There is no assurance that any investments identified will remain in client accounts at the time you receive this document.
Some of the material presented is based upon forward-looking statements, information and opinions, including descriptions of anticipated market changes and expectations of future activity. Strategic Financial Services believes that such statements, information, and opinions are based upon reasonable estimates and assumptions. However, forward-looking statements, information and opinions are inherently uncertain and actual events or results may differ materially from those reflected in the forward-looking statements. Therefore, undue reliance should not be placed on such forward-looking statements, information and opinions.
No content on this website is intended to provide tax or legal advice. You are advised to seek advice on these matters from separately retained professionals.
All index returns, unless otherwise noted, are presented as price returns and have been obtained from Bloomberg. Indices are unmanaged and cannot be purchased directly by investors.