Star-Spangled Salute
 Doug Walters
Positive results in the retail space helped improve investor sentiment sending U.S. stocks to their largest weekly gain since February. This weekend, Strategic gives special thanks to the men and women who gave their lives protecting our country.
Market Review
Contributed by Doug Walters
Consumption function
The S&P 500 bounced back this week, reversing much of the damage from the gradual slide that began in mid-April. On this weekend of remembrance, we ask readers to recall two weeks back (Ed18: “Forest for the Trees”) when we discussed the U.S. retail sales conundrum. The data pointed toward modest improvement, yet the prevailing commentary was decidedly negative, with focus on disappointing results from bellwethers like Nordstrom’s (JWN) and Target (TGT). Since then, sentiment come in line with the data.
- Results from Strategic holdings like Walmart (WMT), Ulta Salon (ULTA) and Dollar Tree (DLTR), showed that there is still life in the consumer (see the Strategy Update section). We may be going through a transition in purchasing habits, but there are still winners in this environment.
- Another positive sign came from the housing market where new home sales rose over 23% versus the same month last year. This was a big reversal of trend and another indication that the U.S. consumer is alive and well.
Priceless
Regular readers of insights are well aware that when it comes to investment selection, Quality is a key criteria at Strategic. So we were beyond amused when we opened a fortune cookie at a recent lunch outing that read, “Quality isn’t expensive. It’s priceless”. But what exactly do we mean by “Quality”?
- MSCI provides a quality stock index that factors in: high return on equity (a profitability measure), stable earnings and low debt levels. This is a good start, but we go further.
- Examples of additional measures we factor in include: strength of the management team, quality of the earnings (do they flow through to cash), exposure to secular growth themes, and defensible business model, to name but a few.
- In our experience, a focus on quality helps protect against one of the greatest risks an investor faces – permanent loss of capital.
| Indices & Price Returns | Week (%) | Year (%) |
|---|---|---|
| S&P 500 | 2.3 | 2.7 |
| S&P 400 (Mid Cap) | 2.9 | 6.7 |
| Russell 2000 (Small Cap) | 3.4 | 1.3 |
| MSCI EAFE (Developed International) | 2.1 | -2.8 |
| MSCI Emerging Markets | 2.9 | 1.8 |
| S&P GSCI (Commodities) | 1.2 | 19.3 |
| Gold | -3.4 | 14.0 |
| MSCI U.S. REIT Index | 1.9 | 4.7 |
| Barclays Int Govt Credit | 0.1 | 1.8 |
| Barclays US TIPS | 0.2 | 4.2 |
Economic Commentary

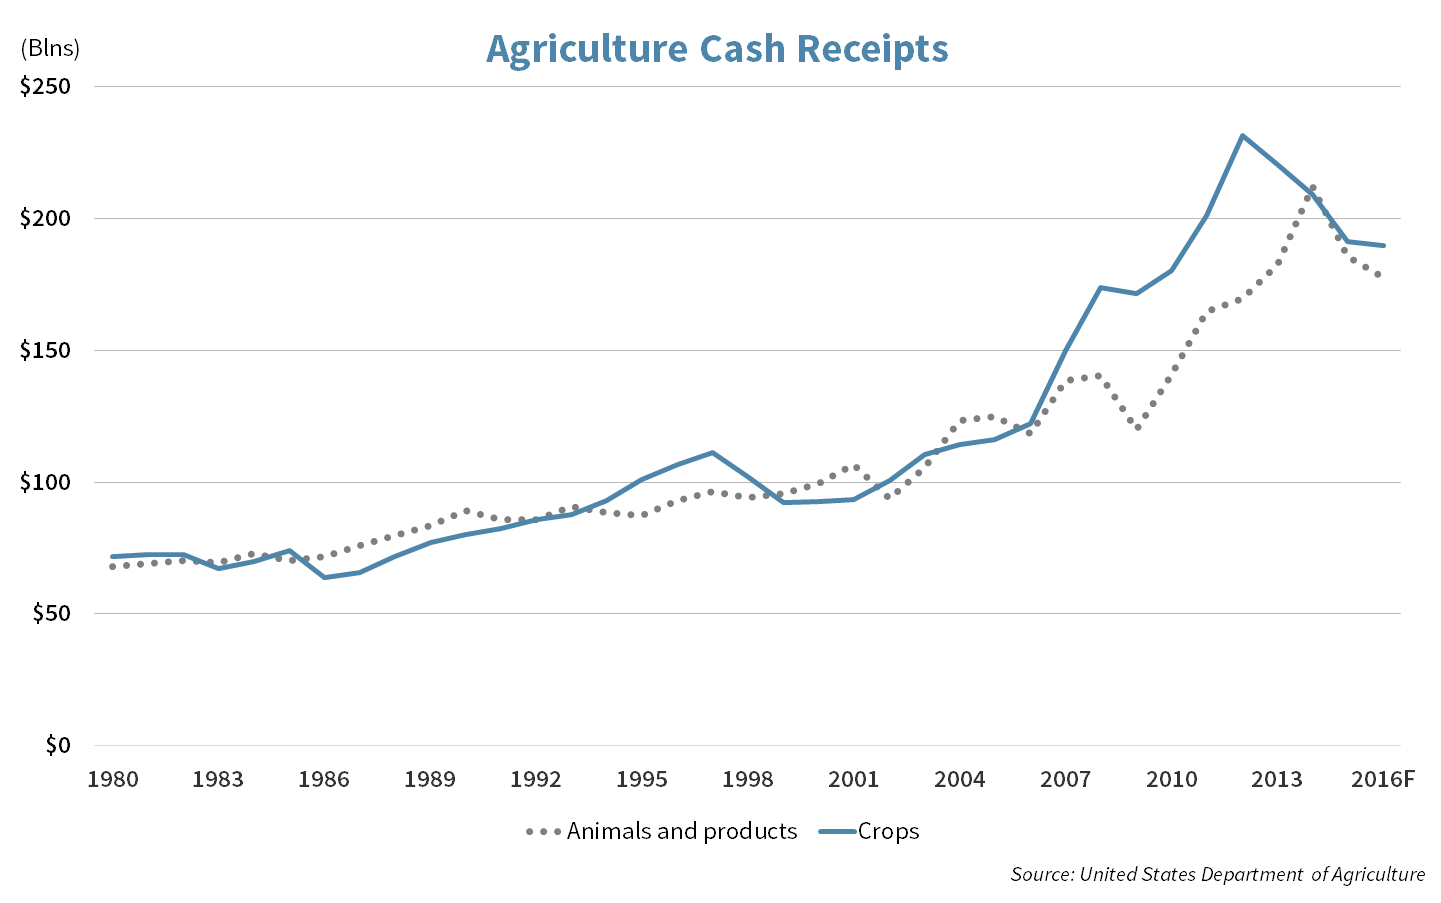
Agronomics
Demand for US based farm products soared from 1990 to 2012 due to globalization and emerging market strength. Countries around the world imported record amounts of cattle and poultry from the American farmer.
Corn prices peaked at a record $7.63 a bushel in 2012 (helped in part by a severe drought), but have since fallen to $3.97. Corn is not alone, as agricultural prices across the board have slid in recent years. This week’s chart shows that cash receipts from crops including wheat, corn, and cotton peaked in 2012 at $232 billion, while receipts from animals and their products including cattle, hogs, milk, poultry and eggs peaked in 2014 at $212 billion. They are projected to end this year down 18% and 16% respectively from those peaks this year.
Explanations for the downturn in agriculture revenue include:
- Oversupply: Farmers began to anticipate the stronger growth, which ultimately proved unsustainable. The ensuing oversupply led to lower prices and lower cash receipts. A pull back after such rapid growth is natural.
- Good weather: The last few growing seasons have been strong due to favorable farming conditions which exacerbated the glut of supply.
Stocks like agricultural equipment manufacturer Deere & Company (DE), have been on hold for the better part of five years due to this dynamic. This has opened up a valuation opportunity for patient long-term investors.
Week Ahead
A time to remember
Originally called Decoration Day, the last Monday of May gives us the opportunity to remember both those who have fallen for this nation. Strategic tips its hat to these brave souls and their families. This weekend is also the unofficial start of summer.
- 39% of Americans will be traveling this weekend. With gas prices $.45/gallon cheaper and the TSA doing its part to make air travel miserable, AAA estimates 2.1% more of those traveling are expected to be driving to their destination compared to last Memorial Day.
A good month for a hike
The timing of the Fed’s next interest rate rise has been under scrutiny since December. That speculation may come to an end in June.
- Unemployment data for May will be released on Friday. If it meets expectations, this could be one of the final pieces the Fed needs to lock in a June rate hike.
Breaking barriers
The S&P 500, Nasdaq and Dow Jones Industrial are all approaching numerical milestones, and have the potential to breach them in the week ahead.
- Values of 2,100 for the S&P 500, 5,000 for the Nasdaq and 18,000 for the Dow Jones Industrial are all in reach.
The Nasdaq may get a boost, with 3 biotech IPO’s in 4 days next week.
Holiday Road
Estimated percent of Americans planning to travel for Memorial Day. Source: AAA
Strategy Update
Contributed by David Lemire , Max Berkovich
Strategic Asset Allocation
Temperatures and equities rising
While stocks did not quite follow the mercury to highs for the year, this week’s rally was a nice kick off to the summer season. International markets powered by decent gains in Europe finally got a break and beat the U.S. while still lagging significantly over longer time frames.
Late spring cleaning
Fair amount of activity within our stock strategies added marginally to equity allocations with the market pushing weights to the upper end of their recent range.
- Gold has dialed back its gains. Emerging markets remains down for the month even with this week’s stronger performance.
Strategic Growth
Beautilicious
Consumer Discretionary sector was on fire this week with not one, but two beautiful earnings prints…
- Beauty retailer, Ulta Salon (ULTA) did it again. Another beat and raise quarter. Same-store sales were 15% higher, traffic was 11% higher, and each ticket was 4% higher for the quarter. E-commerce sales rose by an eye-popping 39%. The company expects comparable sales to grow 10-12% next quarter.
- Dollar Tree Inc. (DLTR) also beat consensus, but it was Family Dollar integration success that boosted the stock. Evidence indicates that the dollar store concept is a hit with millennials.
- Earlier in the week we added two new companies to the strategy. The first a financial data and software company and the other a regulated substance disposal company. More on both of these additions in the weeks to come.
Strategic Equity Income
Double KO
Technology took this week’s bout, as Apple Inc. (AAPL) had a big bounce back. In other strategy news we knocked two companies out of the strategy and introduced a new fighter to the ring…
- We bid farewell to a carbonated beverage company and an upscale retailer to make room for a best in class pharmacy chain that should benefit from consolidation in the space.
About Strategic
Founded in 1979, Strategic is a leading investment and wealth management firm managing and advising on client assets of over $2 billion.
OverviewDisclosures
Strategic Financial Services, Inc. is a SEC-registered investment advisor. The term “registered” does not imply a certain level of skill or training. “Registered” means the company has filed the necessary documentation to maintain registration as an investment advisor with the Securities and Exchange Commission.
The information contained on this site is for informational purposes and should not be considered investment advice or a recommendation of any particular security, strategy or investment product. Every client situation is different. Strategic manages customized portfolios that seek to properly reflect the particular risk and return objectives of each individual client. The discussion of any investments is for illustrative purposes only and there is no assurance that the adviser will make any investments with the same or similar characteristics as any investments presented. The investments identified and described do not represent all of the investments purchased or sold for client accounts. Any representative investments discussed were selected based on a number of factors including recent company news or earnings release. The reader should not assume that an investment identified was or will be profitable. All investments contain risk and may lose value. There is no assurance that any investments identified will remain in client accounts at the time you receive this document.
Some of the material presented is based upon forward-looking statements, information and opinions, including descriptions of anticipated market changes and expectations of future activity. Strategic Financial Services believes that such statements, information, and opinions are based upon reasonable estimates and assumptions. However, forward-looking statements, information and opinions are inherently uncertain and actual events or results may differ materially from those reflected in the forward-looking statements. Therefore, undue reliance should not be placed on such forward-looking statements, information and opinions.
No content on this website is intended to provide tax or legal advice. You are advised to seek advice on these matters from separately retained professionals.
All index returns, unless otherwise noted, are presented as price returns and have been obtained from Bloomberg. Indices are unmanaged and cannot be purchased directly by investors.