Milestone 20,000
 Doug Walters
The Fed’s aggressive 2017 playbook put a damper on the Dow Jones Industrial Average’s efforts to crest 20,000. We take a look at the impact of rising rates and highlight just how long and painful the road to 20,000 has been for the much quoted index.
Market Review
Contributed by Doug Walters
Great Expectations
The S&P 500 was little changed this week, surviving the Federal Reserve’s decision to raise rates for only the second time in a decade. The move was well telegraphed, with the surprise being the more hawkish stance towards 2017 (see our Economic Commentary for more detail).
- The expectations of a more aggressive rate rise path in 2017 sent equities down on Wednesday. However, it’s worth noting that an even more hawkish stance was taken by the Fed last December, and ultimately that did not pan out.
- The Fed statement put a damper on the other big brewing headline of the week, which was the proximity of the Dow Jones Industrial Average (DJIA) to 20,000.
A Long Time Coming
With the Dow Jones Industrial Average approaching 20,000, we take a moment to frame this milestone. First, we remind readers that we do not hold much affection for the DJIA as an index (see our past Insights, Chasing a Ghost). It is not a real reflection of the overall market, and suffers from the manual selection process of its creators. Nonetheless, it has history and tradition on its side, so we will pay it some lip service this week.
We often hear investors revel in disbelief that the DJIA is nearing 20,000. However, a look at history might have you asking, “what took it so long?”. It has been the natural course of U.S. Equities to reach new highs. Assuming an average annual return of 7%, we would expect an index to double every 10 years. That’s a mathematical fact. However, the DJIA first hit 10,000 over 17 years ago!
- Why did it take so long? The rise to 20,000 was interrupted first by the popping of the Tech bubble, then the financial crisis.
- Stocks had gotten way ahead of themselves 17 years ago, so it makes sense that the road to 20,000 was long. Today, valuations are above average but not extreme, so it is reasonable to assume that the Dow at 40,000 could be achieved by 2026.
| Indices & Price Returns | Week (%) | Year (%) |
|---|---|---|
| S&P 500 | -0.1 | 10.5 |
| S&P 400 (Mid Cap) | -1.5 | 19.2 |
| Russell 2000 (Small Cap) | -1.7 | 20.1 |
| MSCI EAFE (Developed International) | -0.6 | -2.8 |
| MSCI Emerging Markets | -2.4 | 7.8 |
| S&P GSCI (Commodities) | 0.7 | 26.3 |
| Gold | -2.1 | 6.5 |
| MSCI U.S. REIT Index | -0.8 | 2.8 |
| Barclays Int Govt Credit | -0.6 | -0.5 |
| Barclays US TIPS | -1.5 | 1.3 |
Economic Commentary
The Fed Re-Rates
The Federal Reserve this week finally raised its core interest rate by 0.25% to a target rate of 0.50-0.75%. While the decision was widely expected by analysts, the Fed’s projections for interest rate hikes next year were more aggressive than expectations. Federal Reserve Chairwoman Yellen stated that she expects three rate hikes next year; one more than anticipated. The jump in the Fed Rate has moved markets across the globe with the benchmark U.S. 10-year Treasury yield up 20 basis points this month to 2.59%.
Most analysts agree interest rates will go up next year. The debate is how fast they will increase as economic growth, inflation and investment demand will all play a role. With fiscal spending expected to increase and unemployment tightening at 4.6%, inflation may begin to pick up. If core inflation exceeds the Fed Funds long-term target of 2%, they may be forced to raise rates faster, which would have ripple effects on all other capital markets.
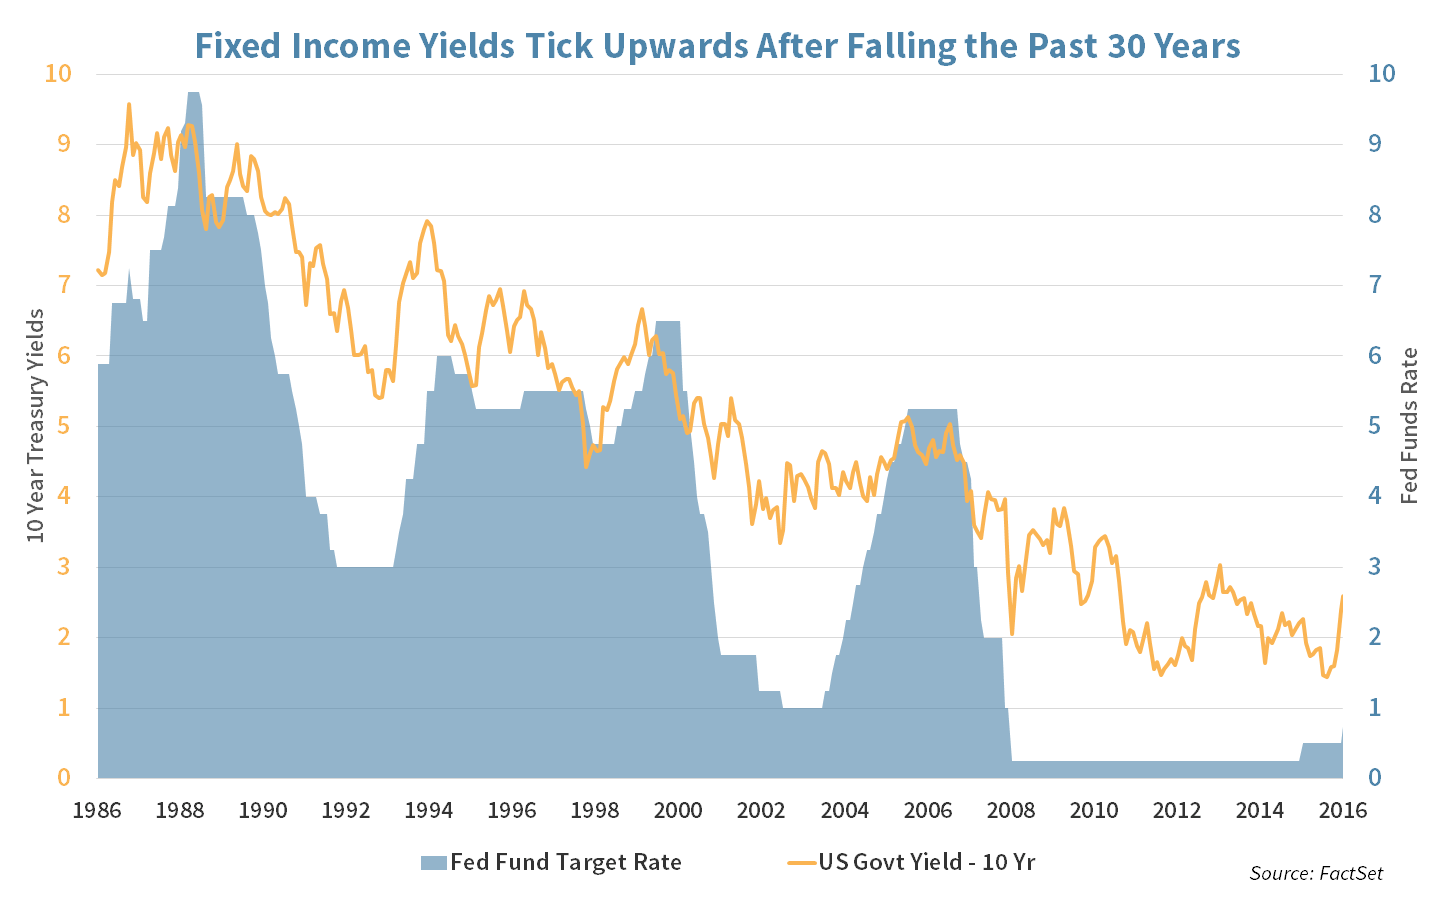
Rising rates are usually a sign that the economy is strong and growing at a rate where inflation becomes problematic. While an increase in Treasury-yields will force bond markets (with lower locked-in yields) to sell off, they can also negatively impact other investment classes that have to compete against a risk-free investment return. With that said, we have several relatively recent periods of steep yield increases that provide optimism for equities: 1993-1995, 1998-2000 and 2013. Large-cap equities were flat in 1993-1995, but increased by a remarkable 46% in 1998-2000 and 38% in 2012-2013.
Current 10-Year U.S. Treasury yield
Week Ahead
Home Sweet Home
Existing home sales for November are expected to decline to an annual rate of 5.5 million from 5.6 million sales per year. Per the National Association of Realtors:
- The median existing-home price for all housing types in October was $232,200, up 6.0% from October 2015 ($219,100). October’s price increase marks the 56th consecutive month of year-over-year gains.
- There are 2.02 million existing homes available for sale, which is 4.3 percent lower than a year ago (2.11 million) and has fallen year-over-year for 17 straight months.
Getting Personal
The final 3rd Quarter GDP revision is expected to come in at 3.2% vs. the 2.9% original estimate released at the end of October.
- Personal Income growth numbers will be closely watched. Economists are expecting 0.3% growth in November vs. 0.6% growth in the prior month.
- The growth in the expendable income tends to translate to inflation growth.
Electoral College in session
On Monday, December 19th, the Electoral College is going to cast their definitive votes. Some trivia ahead of the event:
- In 1876 Samuel Tilden earned a majority of popular votes, but Rutherford B. Hayes won by a single electoral vote.
- The Constitution and federal law do not require electors to abide by the results of the popular vote in their states, so occasionally “faithless electors” go rogue and cast ballots for candidates other than the one to whom they are pledged.
- There have been over 700 proposals introduced in Congress to reform or eliminate the Electoral College. In 1969, an amendment that passed overwhelmingly in the House (338 to 70) and had the endorsement of President Richard Nixon was filibustered and killed in the Senate.
Strategy Updates
Contributed by Max Berkovich ,
STRATEGIC Asset Allocation
Bond Check
The 10-Year U.S. Treasury touched the year’s high of 2.60% Longer duration bonds (ie. those with more distant maturities) will decline the most in price while interest rates are rising.
- To combat this, we have generally been recommending a relatively short duration laddered portfolio.
The Rally
The rally since the elections has left some puzzled and it is not uncommon for analysts to scrutinize freshly touched highs. In 2013, the S&P 500 reached new highs and continued its upward movement for nearly two years. Today, cash is moving from bonds into equity markets, further fueling the rally, as bond holders prepare for higher interest rates.
- We continue to keep a watchful eye on our capital growth portfolio as the rally has started to push allocations to the higher side of our targets and equity valuations are facing upward pressure. However, with bonds falling, cash may be the allocation of choice in the event that we rebalance.
Geography Lesson
MSCI Inc. indices ratified that Peru will remain classified as an emerging market for equities. As a result, the few that made a bet on Peru have gained 63% year-to-date, the best performing single country ETF (EPU). However, the bet was not without risk. In 2015, MSCI had warned investors that Peru could be downgraded to frontier status as the credit default risk continued to increase along with uncertainty in government changes, making a bet nearly impossible for risk averse investors but a lucrative bet for those who dared to gamble. We prefer a basket approach and generally recommend a full complement of emerging markets instead.
Strategic Growth
Playing Ketchup
The Energy sector was an undisputed laggard for the week. The Health Care, Consumer Staples and Technology sectors found favor with investors this week. In other strategy news…
- Mondelez International Inc. (MDLZ) was subject of an M&A rumor late Wednesday. Switzerland’s Bilanz magazine cited a “very well informed” source who claimed that the Kraft Heinz Co. (KHC) is putting together a bid for the snack giant. Interesting rumor, as Kraft Co. was spun out from Mondelez in 2012 and later acquired by ketchup giant H.J. Heinz in 2015 in a deal arranged by 3G Capital and Warren Buffet’s Berkshire Hathaway Inc. (BRK.A & BRK.B). As sweet as a combination sounds, Mondelez announced Thursday it has not received an offer from Kraft and that it has no reason to believe the Swiss magazine’s report is true. However, often where there’s smoke, there’s fire. Stay tuned!
Strategic Equity Income
Generally Speaking
Financials continue their hot streak driven by banks, while the Industrial sector cooled this week. In other news…
- General Electric Co. (GE) during an investor presentation announced its guidance. The memorable number was a $2 target for earning per share for 2018, with revenue growth of 3-5%. The company also expects to return $19 to $22 billion to investors next year, a big step-down from the $30 billion they returned in 2016.
About Strategic
Founded in 1979, Strategic is a leading investment and wealth management firm managing and advising on client assets of over $2 billion.
OverviewDisclosures
Strategic Financial Services, Inc. is a SEC-registered investment advisor. The term “registered” does not imply a certain level of skill or training. “Registered” means the company has filed the necessary documentation to maintain registration as an investment advisor with the Securities and Exchange Commission.
The information contained on this site is for informational purposes and should not be considered investment advice or a recommendation of any particular security, strategy or investment product. Every client situation is different. Strategic manages customized portfolios that seek to properly reflect the particular risk and return objectives of each individual client. The discussion of any investments is for illustrative purposes only and there is no assurance that the adviser will make any investments with the same or similar characteristics as any investments presented. The investments identified and described do not represent all of the investments purchased or sold for client accounts. Any representative investments discussed were selected based on a number of factors including recent company news or earnings release. The reader should not assume that an investment identified was or will be profitable. All investments contain risk and may lose value. There is no assurance that any investments identified will remain in client accounts at the time you receive this document.
Some of the material presented is based upon forward-looking statements, information and opinions, including descriptions of anticipated market changes and expectations of future activity. Strategic Financial Services believes that such statements, information, and opinions are based upon reasonable estimates and assumptions. However, forward-looking statements, information and opinions are inherently uncertain and actual events or results may differ materially from those reflected in the forward-looking statements. Therefore, undue reliance should not be placed on such forward-looking statements, information and opinions.
No content on this website is intended to provide tax or legal advice. You are advised to seek advice on these matters from separately retained professionals.
All index returns, unless otherwise noted, are presented as price returns and have been obtained from Bloomberg. Indices are unmanaged and cannot be purchased directly by investors.