Back in Black
 Doug Walters
Despite a difficult start to the year for equities, the S&P 500 is up year-to-date. We believe the first quarter may turn out to be a microcosm of 2016: elevated volatility with opportunities for disciplined active investors.
Market Review
Contributed by Doug Walters
Plug Your Nose
Investors had a lot to digest in the first quarter of 2016, and not all of it was particularly palatable. Oil prices declined, leading many to conclude that economic demand was crumbling. Media commentary turned decidedly negative, with numerous references to recession fears. The terror attacks in Brussels were a bitter pill for market optimism and to say nothing of the state of the overall world scene. Yet, despite this unappetizing menu of challenges, the S&P 500 was able to plug its nose and end the quarter in positive territory.
Cleanse Your Palate
The second half rally did not come as a surprise to us. It is not that we have a crystal ball; rather we have not seen convincing signs of economic trouble. The U.S. economy remains “OK” and that is good enough for markets right now.
- Oil, in our view, remains more of a supply issue than a demand issue, and should not reflect badly on the economy (see our Economic Commentary).
- The U.S. economy remains stable, and Friday’s non-farm payrolls report shows that jobs continue to be created to the tune of 215,000 in March and nearly 630,000 thus far in 2016.
- Perhaps most importantly, the Fed proved once again that it is willing to defend the U.S. economy. Expectations for 2016 rate rises have come down, as the Fed struck a more dovish tone, given weakness overseas.
Volatility will likely continue to be a feature throughout 2016. Our focus remains on quality investments that we expect to weather the turbulence, combined with thoughtful rebalancing when volatility creates attractive valuation opportunities.
| Indices & Price Returns | Week (%) | Year (%) |
|---|---|---|
| S&P 500 | 1.8 | 1.4 |
| S&P 400 (Mid Cap) | 2.7 | 3.8 |
| Russell 2000 (Small Cap) | 3.5 | -1.6 |
| MSCI EAFE (Developed International) | -0.4 | -5.8 |
| MSCI Emerging Markets | 3 | 5.4 |
| S&P GSCI (Commodities) | -1.4 | 3.8 |
| Gold | 0.5 | 15.2 |
| MSCI U.S. REIT Index | 3 | 5.1 |
| Barclays Int Govt Credit | 0.4 | 2 |
| Barclays US TIPS | 1.4 | 4.6 |
Economic Commentary
Volatile Oil
The oil price remains volatile and dropped this week due to production continuing to come online into an oversupplied market. The price had rallied since February on hopes of a production “freeze” from major OPEC and non-OPEC producers including Saudi Arabia, Russia, Qatar and Venezuela. These countries will hold a meeting on April 17 but we remain cautious on it leading to any meaningful change to the supply demand imbalance.
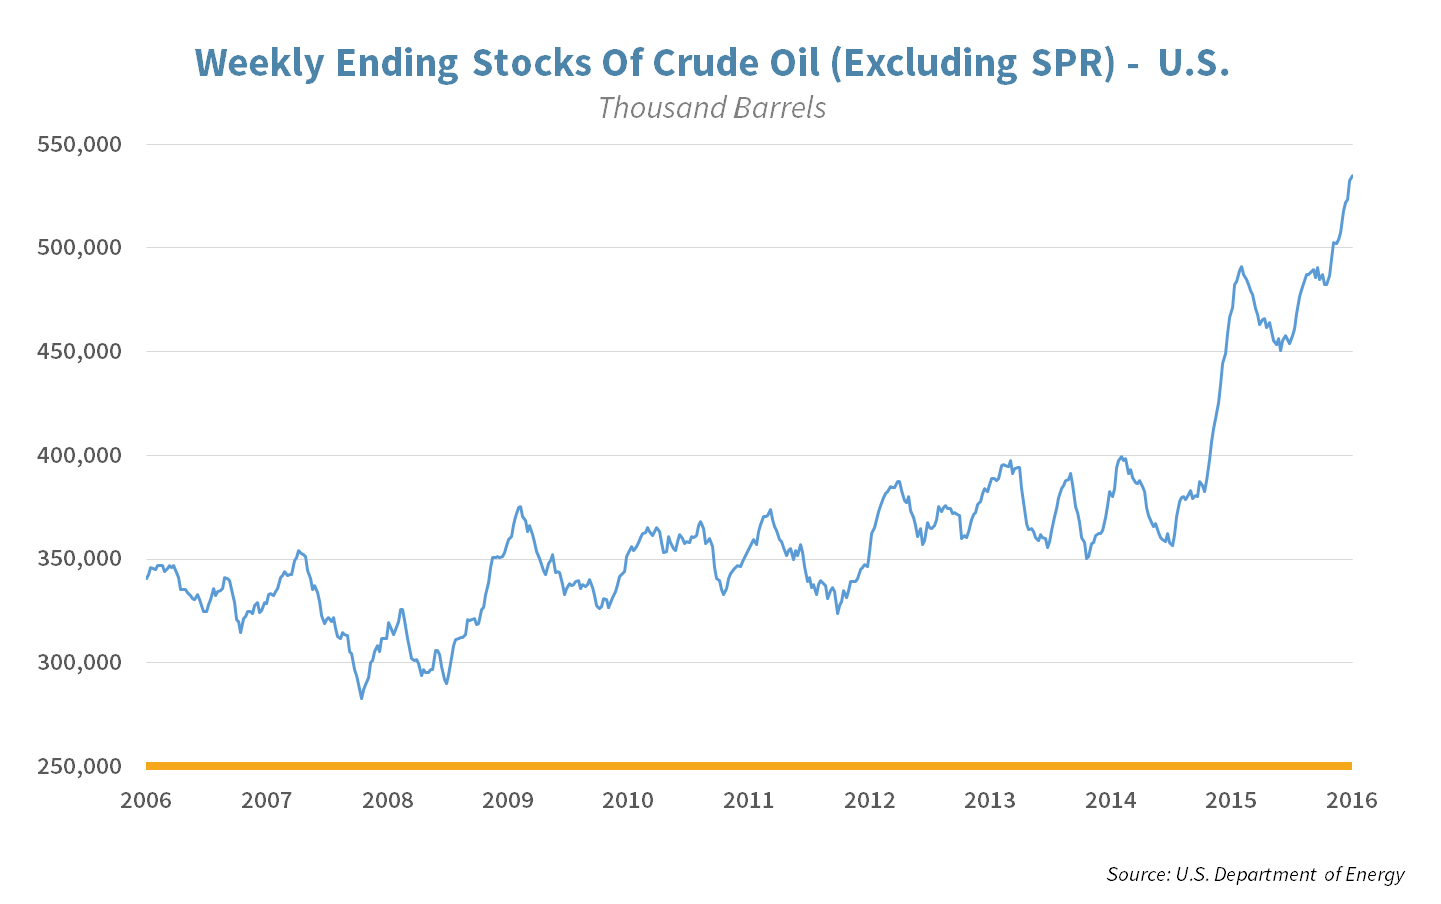
The conventional wisdom among energy analysts has been that oil prices would recover this year given that the United States rig count has dropped. A lower rig count means less drilling and the oil wells that already exist naturally pump out less crude with time. However, these analysts have been proven wrong as United States oil production, although down from record highs, still remains strong at over 9 million barrels per day. It turns out, oil companies have been able to reduce costs and focus on their most prolific reserves. This dynamic may change as the price of oil falls even lower but as of now, oil inventories continue to increase even though they are at 80 year highs.
To minimize the risk of lower oil prices, our investment strategies focus only on high quality energy companies that have
- low amounts of debt
- lower costs than their competitors and
- asset diversification
Week Ahead
Contributed by Aaron Evans
Cliff Notes
Minutes from the Federal Reserve’s March policy meeting will be released next week, giving us some insight into their latest thoughts on the future of interest rates.
- Friday’s March jobs report noted a slight uptick in labor force participation (Americans actively searching for employment) which could suppress wage inflation and provide the Fed with a bit of cushion in timing the next rate hike.
Unlike Any Other
The Masters kicks off next Thursday at the famed Augusta National Golf Club, with a total purse of $10M for players who make Saturdays cut.
- Scoring matters, with last year’s winner taking home $1.8M and those just 12 strokes off the lead receiving under $200K for their efforts.
- Often considered the most exclusive club in the country with only 300 members and another 300 on a waiting list, annual dues are $25-50K which is actually modest compared to the country’s most private clubs. A small price to pay to hang with Bill Gates, Warren Buffet and Condoleezza Rice (not to mention Tiger, Jack and Arnie).
Strategy Update
Strategic Asset Allocation
Pit Stop
Equity markets finished the first quarter quite strongly after a difficult January and a nondescript February. March generally saw mid to high single digit gains. Bonds continued to plod along posting positive returns in each month for the quarter. Gold beat to its own drum, posting strong gains while equities sold off and eking out a gain in March as equities rallied.
Deeper Dive
U.S. markets outpaced International for the quarter due to stronger performance from mid-caps while small-caps remain in the red. International markets had a strong March but it too remains in negative territory for the quarter. As is often the case, currency played an important role internationally. U.S. Dollar headwinds turned tailwinds as the quarter progressed, the Fed seems unhurried to raise rates so dollar bulls retreated somewhat.
Portfolio Positioning
Despite the financial market volatility this quarter, overall asset allocations remain close to home. As the second quarter starts, we remain tilted towards equities and other growth assets. Bonds remain the anchor of the portfolio and we continue to favor intermediate maturities as well as higher quality corporates.
STRATEGIC Growth
Child’s Play
The 1St Quarter brought lots of market volatility with the Industrial and Materials sector eventually coming out on the top. On the other side, Financials had a tough quarter, but Energy was even worse. Biggest stock movers were…
- The top performer was Carter’s Inc. (CRI) which benefited from consumer spending on baby clothing. The company had a record year in 2015 and expects another record in 2016.
- The last place finish came from the Biotech Sector ETF (BBH) which has received negative press during this election cycle. Despite short-term negative sentiment, we continue to see significant tail winds in the future for the industry and added to the position on weakness for clients in this strategy.
STRATEGIC Equity Income
Hot Pipes
The Telecom & Utilities sectors finished the quarter at the top leaving all other sectors in the dust. Financials had the worst quarter by far. The biggest stock movers were…
- Spectra Energy (SE) an energy infrastructure company that roared back with a vengeance, but still fell short of recovering 2015’s losses. The company increased its dividend unlike its peers.
- The biggest loser was HSBC Corp (HSBC). The global banking goliath keeps taking hits; negative interest rates in parts of the world and a threat of Brexit are just the most recent.
Let's Go Orange!
Contributed by Michael Leist
About Strategic
Founded in 1979, Strategic is a leading investment and wealth management firm managing and advising on client assets of over $2 billion.
OverviewDisclosures
Strategic Financial Services, Inc. is a SEC-registered investment advisor. The term “registered” does not imply a certain level of skill or training. “Registered” means the company has filed the necessary documentation to maintain registration as an investment advisor with the Securities and Exchange Commission.
The information contained on this site is for informational purposes and should not be considered investment advice or a recommendation of any particular security, strategy or investment product. Every client situation is different. Strategic manages customized portfolios that seek to properly reflect the particular risk and return objectives of each individual client. The discussion of any investments is for illustrative purposes only and there is no assurance that the adviser will make any investments with the same or similar characteristics as any investments presented. The investments identified and described do not represent all of the investments purchased or sold for client accounts. Any representative investments discussed were selected based on a number of factors including recent company news or earnings release. The reader should not assume that an investment identified was or will be profitable. All investments contain risk and may lose value. There is no assurance that any investments identified will remain in client accounts at the time you receive this document.
Some of the material presented is based upon forward-looking statements, information and opinions, including descriptions of anticipated market changes and expectations of future activity. Strategic Financial Services believes that such statements, information, and opinions are based upon reasonable estimates and assumptions. However, forward-looking statements, information and opinions are inherently uncertain and actual events or results may differ materially from those reflected in the forward-looking statements. Therefore, undue reliance should not be placed on such forward-looking statements, information and opinions.
No content on this website is intended to provide tax or legal advice. You are advised to seek advice on these matters from separately retained professionals.
All index returns, unless otherwise noted, are presented as price returns and have been obtained from Bloomberg. Indices are unmanaged and cannot be purchased directly by investors.