A 30,000 Foot Eye-Opener
 Doug Walters
Successful investors know the stock market has rewarded those willing to look beyond the daily emotional swings and focus on the long-term. We have the pictures to prove it.
Contributed by Doug Walters
This past week was Spring Break for my children, but it was anything but a break for the Strategic investment team, as we are in the heart of corporate earnings season (sorry kids, no vacation). So to honor the spirit of the week, we take a break from our typical Strategic Insights format and focus on a couple of pictures that we believe say a thousand words (or maybe even 30,000).
The View from Above
With volatility in full swing, the financial media is in their glory, spewing sensational stories designed to captivate and entertain viewers. However, when you strip out the emotion, investing is (and should be) far more boring. As famed investor George Soros once said, “If investing is entertaining, if you’re having fun, you’re probably not making any money. Good investing is boring.” We find that the right pictures can often cut through the media hyperbole and provide a clearer picture of investing reality. In this light, we look at the U.S. stock market first from 1,500 feet than from 30,000 feet.
What is Normal? – the 1,500 Foot View
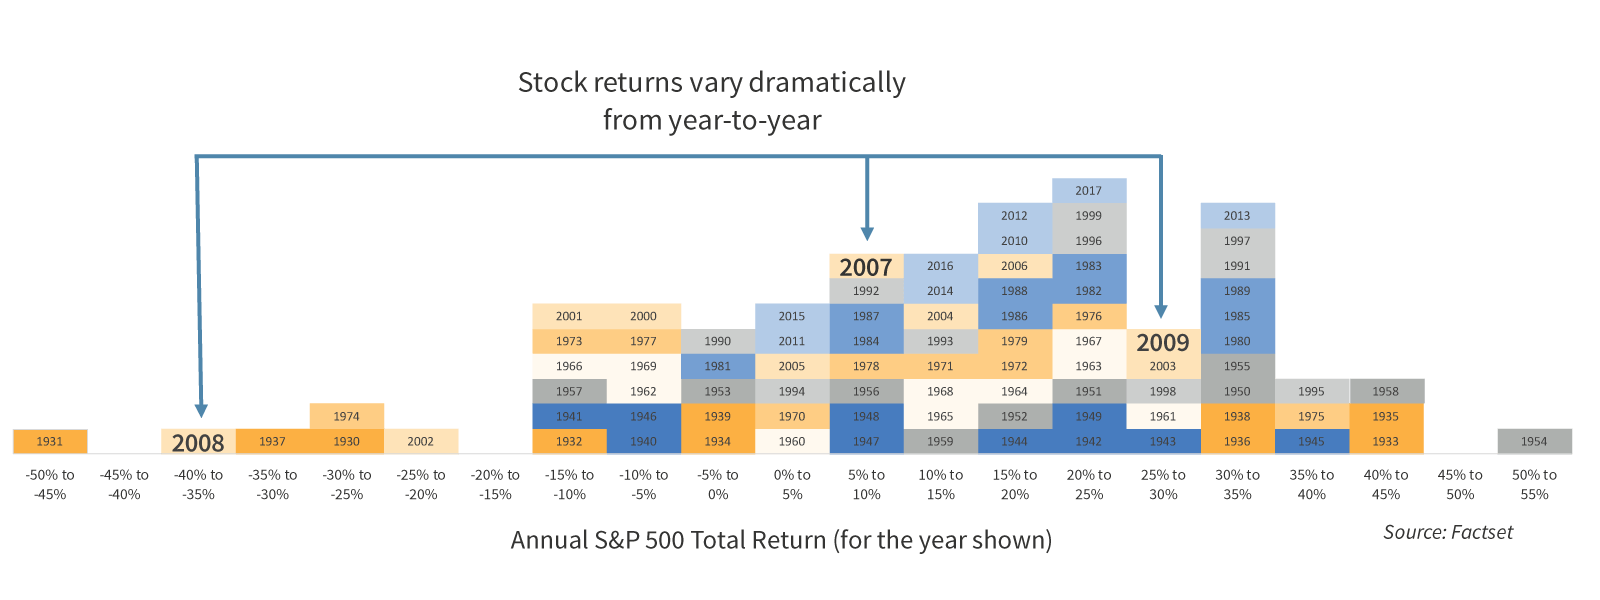
In times like this, where volatility is rising and uncertainty “feels” elevated, it is important to remind investors that this is normal. From one year to the next, stock performance can vary dramatically. The chart below shows the total return of the S&P 500 for each year since the start of the Great Depression. The dispersion is wide, ranging from nearly -50% in 1931 to almost +50% in 1954.
We have organized the decades by color so that at a glance you can see that the annual returns over the past 20 years have varied significantly. In fact, two of the worst years since 1929 occurred within the past two decades (2002 Tech Bubble bursting and 2008 Financial Crisis).
Investing is Boring – the 30,000 Foot View
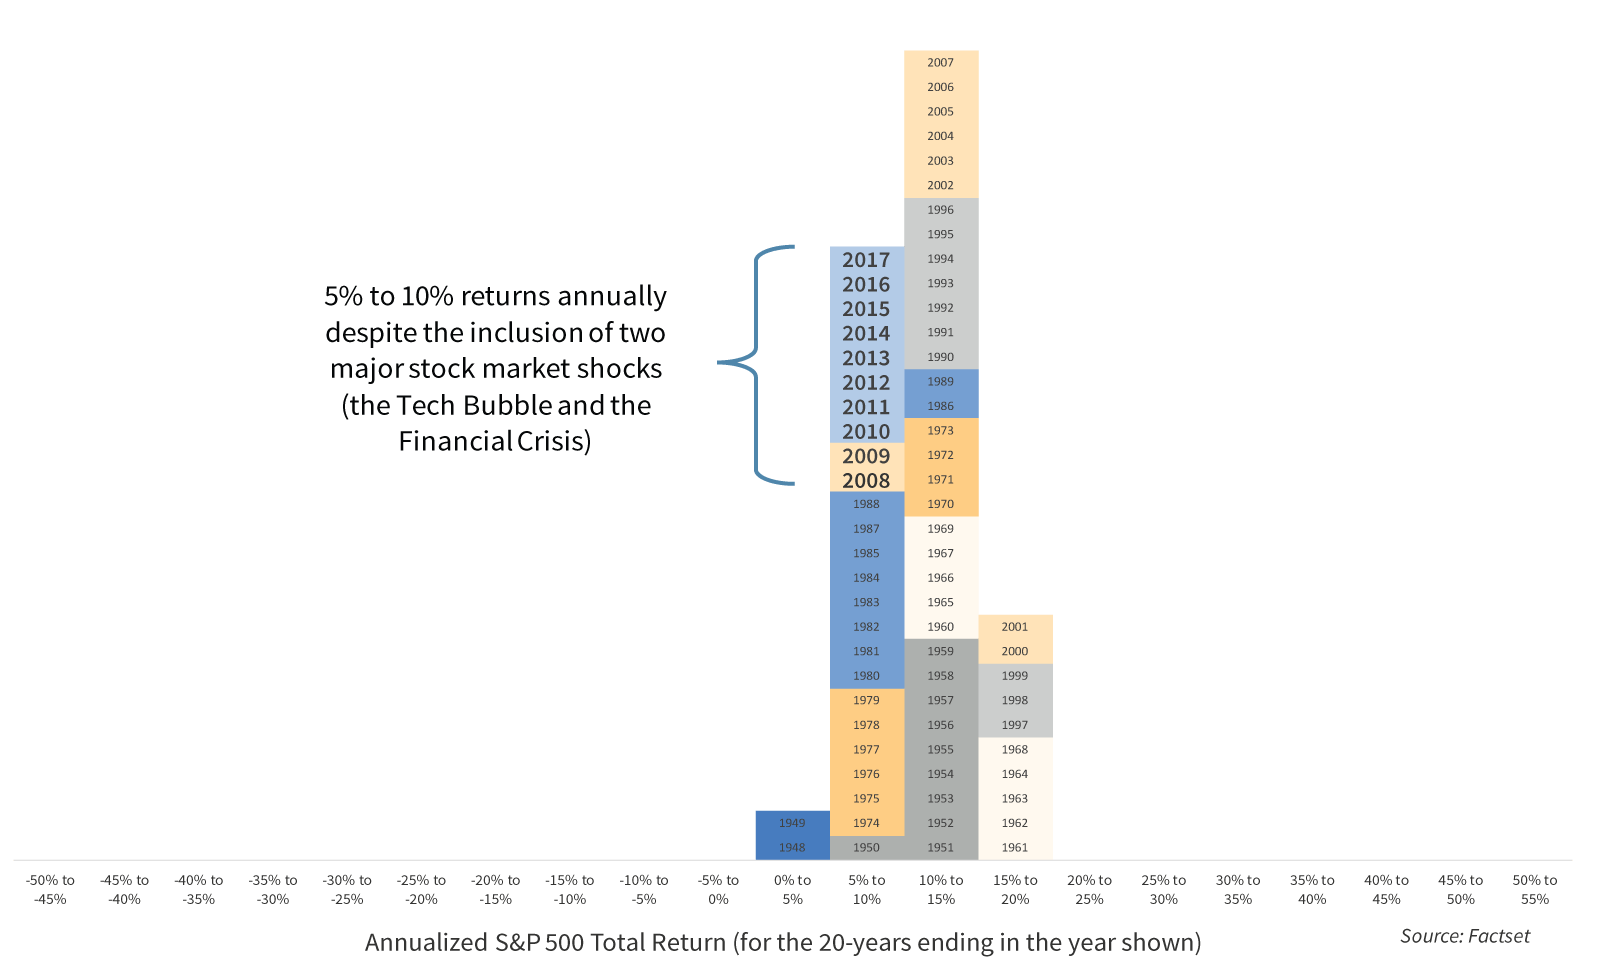
However, investing is a long-term endeavor, and over the long-term, returns are much more predictable. Using the same approach as above, but annualizing returns over 20-year periods, we see a much tighter dispersion of stock returns. The picture below shows that the annualized return for the 20-year period ending in 2017 was between 5% and 10% (it was actually 7.2%). This return is amazing! Why? The 20-year period ending in 2017 included both the bursting of the Tech Bubble and the Financial Crisis; two of the worst stock market shocks in modern U.S. history. The same is true for 2008, 2009 and every other 20-year period that includes both of these horrific market shocks. How good is a 7.2% return for 20 years? A $100,000 investment in the S&P 500 at the start of 1998 would have grown to about $400,000 by the end of 2017!
The Lesson
Stock market volatility is unavoidable and normal. At times we will even have to endure extraordinary market shocks like the Financial Crisis. This is okay. The return that investors have historically been able to achieve by holding stocks for the long-term is compensation for this volatility risk. Successful investors always keep the 30,000-foot view in mind. They do not try to time the market’s ups and downs. Their success comes from holding their nerve when stocks decline and staying fully invested so that they participate in 100% of the long-term upside that the market has to offer.
We published a white paper on the dangers of market timing (link below), but perhaps these two pictures above tell you all you need to know. Have a great weekend.
About Strategic
Founded in 1979, Strategic is a leading investment and wealth management firm managing and advising on client assets of over $2 billion.
OverviewDisclosures
Strategic Financial Services, Inc. is a SEC-registered investment advisor. The term “registered” does not imply a certain level of skill or training. “Registered” means the company has filed the necessary documentation to maintain registration as an investment advisor with the Securities and Exchange Commission.
The information contained on this site is for informational purposes and should not be considered investment advice or a recommendation of any particular security, strategy or investment product. Every client situation is different. Strategic manages customized portfolios that seek to properly reflect the particular risk and return objectives of each individual client. The discussion of any investments is for illustrative purposes only and there is no assurance that the adviser will make any investments with the same or similar characteristics as any investments presented. The investments identified and described do not represent all of the investments purchased or sold for client accounts. Any representative investments discussed were selected based on a number of factors including recent company news or earnings release. The reader should not assume that an investment identified was or will be profitable. All investments contain risk and may lose value. There is no assurance that any investments identified will remain in client accounts at the time you receive this document.
Some of the material presented is based upon forward-looking statements, information and opinions, including descriptions of anticipated market changes and expectations of future activity. Strategic Financial Services believes that such statements, information, and opinions are based upon reasonable estimates and assumptions. However, forward-looking statements, information and opinions are inherently uncertain and actual events or results may differ materially from those reflected in the forward-looking statements. Therefore, undue reliance should not be placed on such forward-looking statements, information and opinions.
No content on this website is intended to provide tax or legal advice. You are advised to seek advice on these matters from separately retained professionals.
All index returns, unless otherwise noted, are presented as price returns and have been obtained from Bloomberg. Indices are unmanaged and cannot be purchased directly by investors.